
Secondary V • 3yr.
thank you so much. I also have this question that is related to the first question.
thank you so much. I also have this question that is related to the first question.


Explanation from Alloprof
This Explanation was submitted by a member of the Alloprof team.
Thank you for your question!
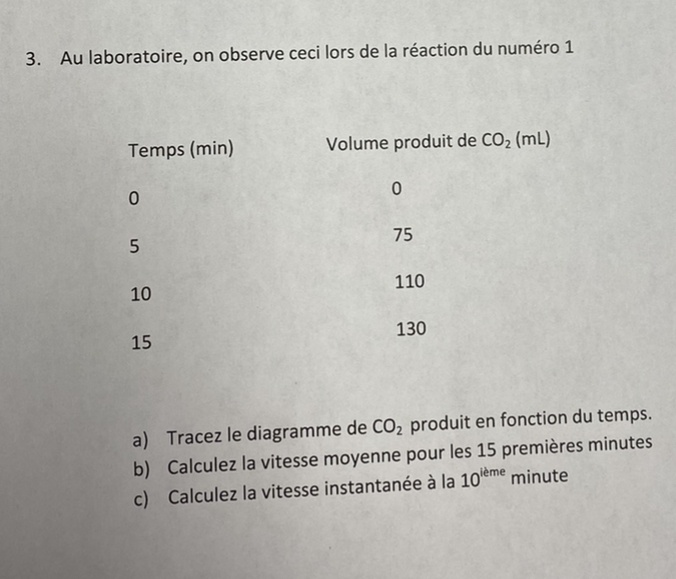
For letter a, you must plot the amount of CO2 produced against time. This graph should have time on the x axis and CO2 volume on the y axis.
For letter b, you have to calculate the mean reaction rate for the first 15 minutes. To do this, you can simply divide the volume of CO2 at 15 minutes by 15. This is like calculating the mean, except that you already have the total sum of CO2 volumes produced at different times.
There are many different ways to proceed for letter c. You could either measure the tangent of CO2 variation between 5 and 15 minutes on your graph, or you can calculate the slope between 5 and 15 minutes using the following formula :
$$ slope=\frac{y_2-y_1}{x_2-x_1} $$
In this situation, the slope is equal to the instantaneous rate of reaction.
Let us know if you need more help!