Ce contenu est protégé par le droit d'auteur. Toute reproduction à l'extérieur des forums Alloprof est interdite et pourra être considérée comme une violation du droit d'auteur.
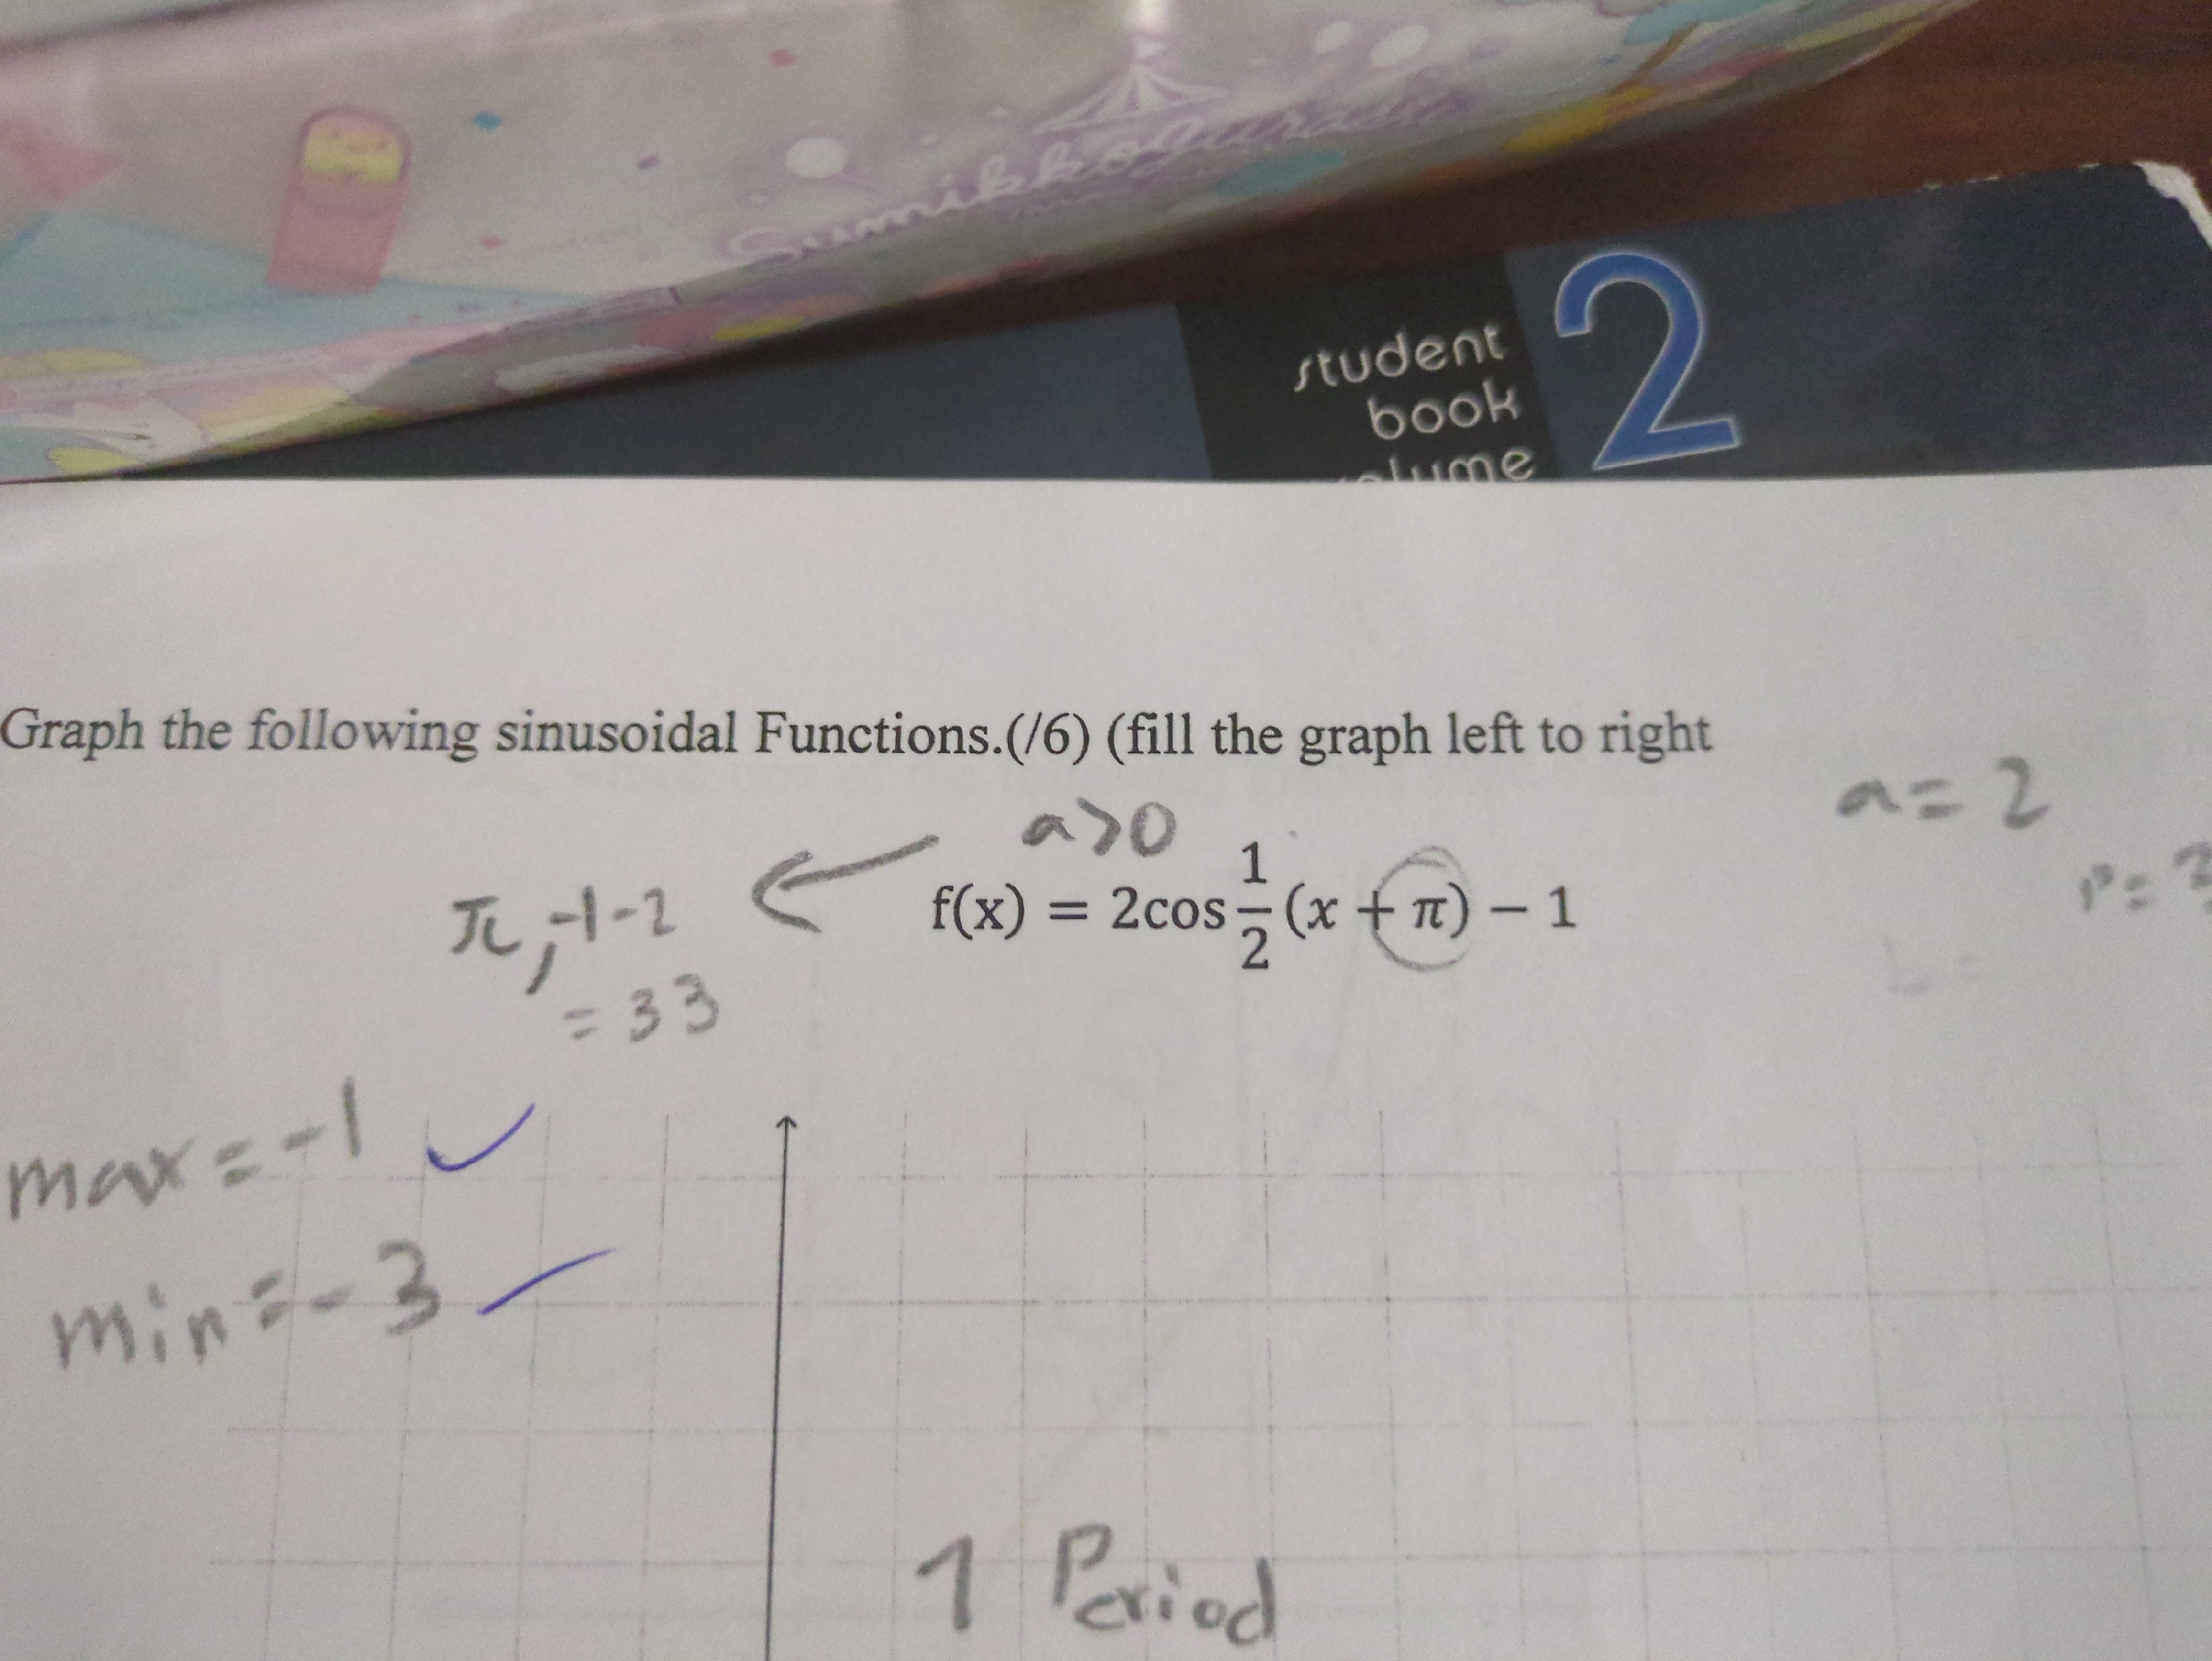
If you want to create a graph of a sine function, the first step is to identify the parameters a, b, h, and k.
The parameter a determines the amplitude of the wave and the parameter b helps you find the period, which is the length of one full cycle of the wave. The values h and k correspond to the horizontal and vertical shifts, respectively, and define the inflection point of the curve at (h, k). Once you have these values and the axis of oscillation, you can draw a reference rectangle using the amplitude and period to help you graph the function accurately.


Explication d'Alloprof
Cette explication a été donnée par un membre de l'équipe d'Alloprof.
Hi DynamicTyrannosaurus8368,
Thanks for your question :)
If you want to create a graph of a sine function, the first step is to identify the parameters a, b, h, and k.
The parameter a determines the amplitude of the wave and the parameter b helps you find the period, which is the length of one full cycle of the wave. The values h and k correspond to the horizontal and vertical shifts, respectively, and define the inflection point of the curve at (h, k). Once you have these values and the axis of oscillation, you can draw a reference rectangle using the amplitude and period to help you graph the function accurately.
For step-by-step instructions, feel free to check out this page from Alloprof: https://www.alloprof.qc.ca/en/students/vl/mathematics/graphing-a-sine-function-m1174
Don't hesitate to reach out again if you have more questions :)
Sandrine
Suggestions en lien avec la question
Suggestion en lien avec la question
Voici ce qui a été trouvé automatiquement sur le site, en espérant que ça t’aide!