Subjects
Grades
The sine function is a periodic function represented by a repeating pattern called a cycle. To graph the sine function, use a rectangle to frame a cycle and then reproduce it.
Before graphing the function, it is necessary to define certain terms and their links with the parameters |a,| |b,| |h,| and |k| from the sine function rule: |f(x)=a\sin\!\big(b(x-h)\big)+k.|

|
Definition |
Links with parameters |
|---|---|
|
The period |\color{#333fb1}{(p)}| is the difference between the 2 |x|-values at the extremities of a cycle. The length of the rectangle is equal to the period. |
The period is determined from parameter |b.| |
|
The axis of oscillation (also called the midline), corresponds to the horizontal line intersecting the middle of the function. |
The axis of oscillation is determined from parameter |k.| |
|
Inflection points are all the points intersecting the axis of oscillation. |
There are 3 inflection points in one cycle. Generally, the first inflection point of a cycle corresponds to point |(h,k).| |
|
Amplitude |\color{#fa7921}{(A)}| is the vertical distance between the axis of oscillation and an extremum. The height of a rectangle is equal to |2\color{#fa7921}A.| |
The amplitude is determined using parameter |a.| |
To graph a cycle of a sine function, start at |(h,k),| a point of inflection and end at another point of inflection. The cycle is framed by a rectangle (determined by the period and the amplitude). It is then separated into 4 equal parts, each of which is determined by an inflection point and an extremum.
Take the following steps to graph a sine function.
Determine the amplitude, period, phase shift, and the axis of oscillation.
Determine the maximum and minimum.
Sketch the axis of oscillation and horizontal lines at the maximum and minimum.
Set point |(h,k)|, then sketch the rectangle and the inflection points.
Determine the variation from |a| and |b,| then graph a first cycle.
If |a| and |b| have the same sign, the function increases from |(h,k).|
If |a| and |b| have opposite signs, the function decreases from |(h,k).|
Graph the first cycle and continue the curve on the rest of the Cartesian Plane.
Graph the sine function with the rule |f(x)=1.5\sin\left(\dfrac{\pi}{4}(x-2)\right)-4.|
Determine the amplitude, period, phase shift, and axis of oscillation
From the rule, the following parameters can be identified: |a=1.5,| |b=\dfrac{\pi}{4},| |h=2| and |k=-4.|
|\begin{align}\color{#fa7921}A&=\vert a\vert \\&=\vert1.5\vert\\ &=\color{#fa7921}{1.5}\end{align}|
|\begin{align}\color{#333fb1}p&=\dfrac{2\pi}{\vert b\vert}\\&=\dfrac{2\pi}{\vert\frac{\pi}{4}\vert}\\ &=2\pi \times \dfrac{4}{\pi}\\&=\color{#333fb1}8 \end{align}|
|\begin{align}\color{#a8a39e}{\text{Phase Shift}}&=h\\&=\color{#a8a39e}2\end{align}|
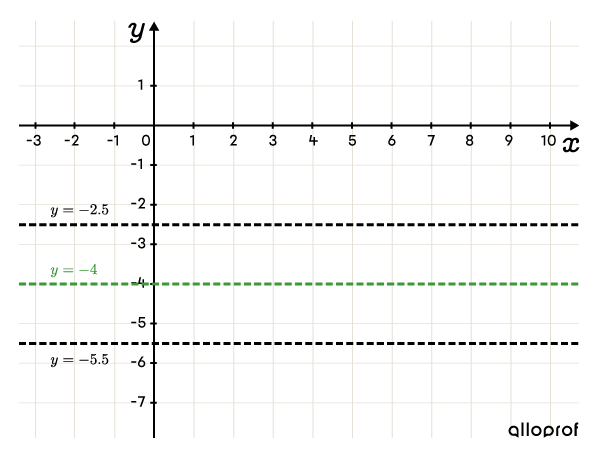
|\begin{align}\color{#3a9a38}{\text{Axis of Oscillation}}:y&=k\\ \color{#3a9a38}{y}&\color{#3a9a38}{=}\color{#3a9a38}{-4}\end{align}|
Determine the maximum and minimum
|\begin{align}\max&=k+\color{#fa7921}A\\&=-4+\color{#fa7921}{1.5}\\&=-2.5\end{align}|
|\begin{align}\min&=k-\color{#fa7921}A\\&=-4-\color{#fa7921}{1.5}\\&=-5.5\end{align}|
Graph the axis of oscillation and horizontal lines at the maximum and minimum
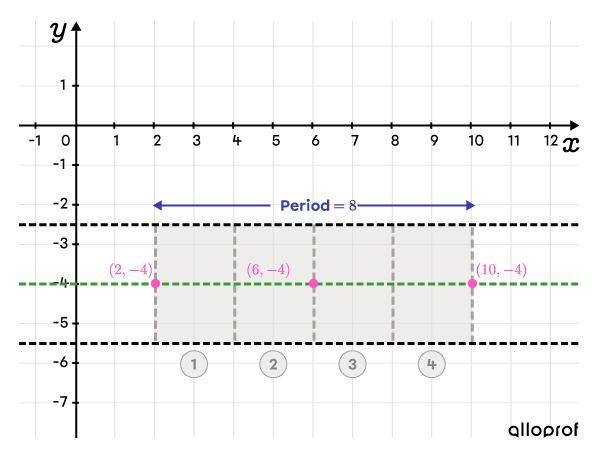
Place point |(h,k),| then draw the rectangle and the inflection points
||(h,k)=(2,-4)|| To find the inflection point at the end of the rectangle, we add the period to the |x|-coordinate of point |(h,k).| ||h+\color{#333fb1}p=2+\color{#333fb1}8=10||
Therefore, the inflection point at the end of the cycle is at |(10,-4).|
Place another inflection point in the middle of the rectangle at |(6,-4).| Next, separate the rectangle into 4 equal parts.
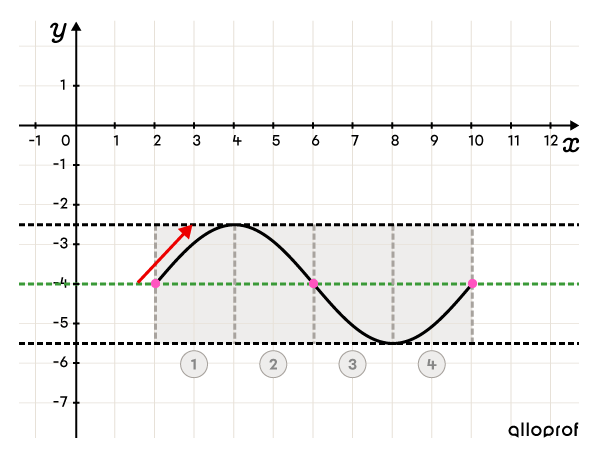
Determine the variation and graph a first cycle
Since |a| and |b| have the same sign, the function increases at the start of the cycle.
Graph the first cycle and continue the curve on the rest of the Cartesian Plane
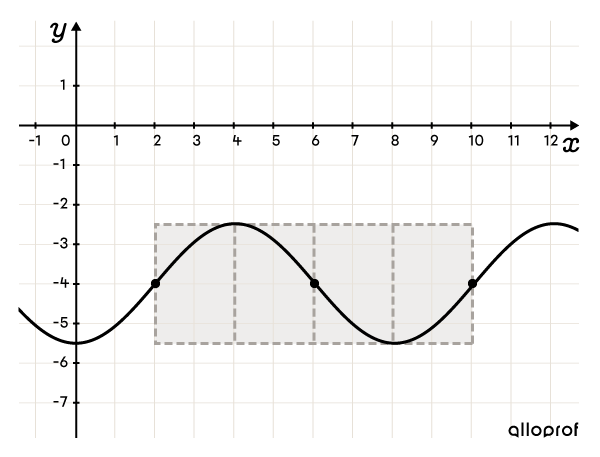
To properly scale the axes, analyse the period (determined in step 1) and the extrema (determined in step 2).
Scale the |x|-axis
The period is separated into 4 equal parts, so the scale on the |x|-axis should at most be equal to |\color{#EC0000}{\dfrac{1}{4}}\color{#333fb1}p.| In the previous example, we set a scale of |1| unit, because the period is |8.| (A scale of |2| units could have worked, but it would have made the function more compressed.)
Sometimes the period is a multiple of |\pi,| such as when using angles measured in radians. In this situation, scale the |x|-axis using |\pi.| For example, if the period is |\color{#333fb1}{2\pi},| the scale could be |\dfrac{\pi}{2}.|||\color{#EC0000}{\dfrac{1}{4}}\color{#333fb1}p=\color{#EC0000}{ \dfrac{1}{4}}{\color{#333fb1}{(2\pi)}}=\dfrac{\pi}{2}||
The following scale is obtained.
After, the fractions can be reduced if desired.
Scale the |y|-axis
The scale of the |y|-axis is determined by the maximum and the minimum. Determine a scale that provides enough space to graph a cycle.
Graph the sine function with the rule |f(x)=-5\sin\left(\dfrac{8}{3}\left(x+\dfrac{3\pi}{4}\right)\right)+2.|
Determine the amplitude, period, phase shift, and axis of oscillation
From the rule, identify parameters: |a=-5,| |b=\dfrac{8}{3},| |h=-\dfrac{3\pi}{4},| and |k=2.|
|\begin{align}\color{#fa7921}A&=\vert a\vert \\&=\vert-5\vert\\ &=\color{#fa7921}{5}\end{align}|
|\begin{align}\color{#333fb1}p&=\dfrac{2\pi}{\vert b\vert}\\&=\dfrac{2\pi}{\vert\frac{8}{3}\vert}\\&=2\pi \times \dfrac{3}{8}\\&=\color{#333fb1}{\dfrac{3\pi}{4}} \end{align}|
|\begin{align}\color{#a8a39e}{\text{Phase Shift}}&=h\\&=\color{#a8a39e}{-\dfrac{3\pi}{4}}\end{align}|
|\begin{align}\color{#3a9a38}{\text{Axis of Oscillation}}:y&=k\\ \color{#3a9a38}{y}&\color{#3a9a38}{=}\color{#3a9a38}{2}\end{align}|
Determine the maximum and minimum
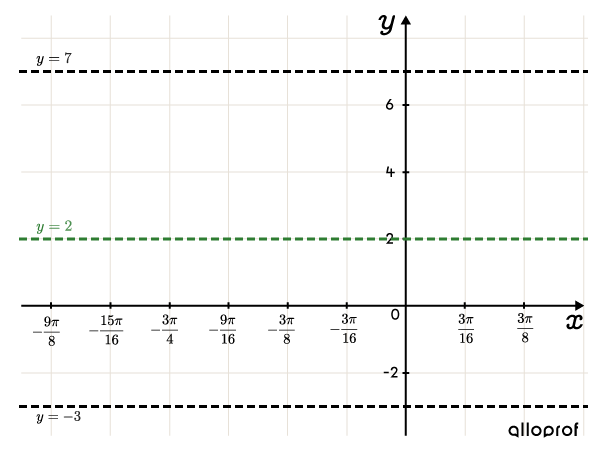
|\begin{align}\max&=k+\color{#fa7921}A\\&=2+\color{#fa7921}{5}\\&=7\end{align}|
|\begin{align} \min&=k-\color{#fa7921}A\\&=2-\color{#fa7921}{5}\\&=-3\end{align}|
Draw the axis of oscillation and horizontal lines at the maximum and minimum
The axis of oscillation and the lines at the maximum and minimum values are shown in the example.
The period is |\color{#333fb1}{\dfrac{3\pi}{4}},| so we can calculate an appropriate scale for the |x|-axis using |\dfrac{3\pi}{16}.|||\color{#EC0000}{\dfrac{1}{4}}\color{#333fb1}{p}=\color{#EC0000} {\dfrac{1}{4}}\color{#333fb1}{\left(\dfrac{3\pi}{4}\right)}=\dfrac{3\pi}{16}||
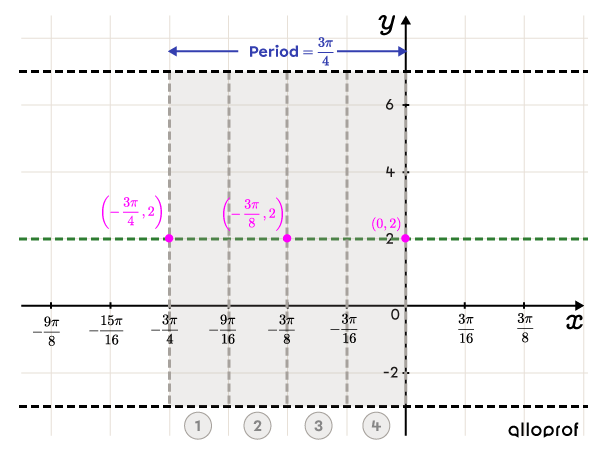
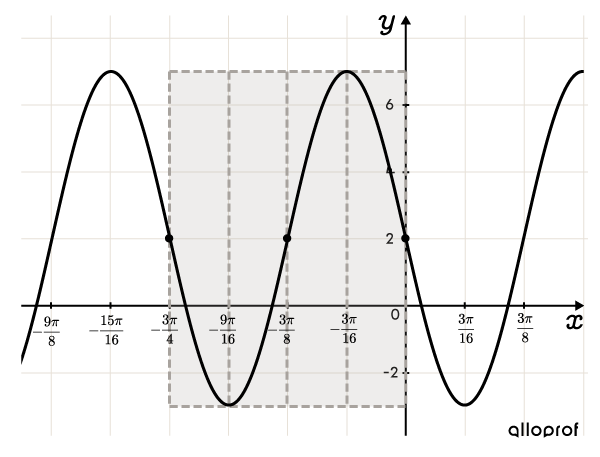
Place point |(h,k),| then sketch the rectangle and the inflection points
||(h,k)=\left(-\dfrac{3\pi}{4},2\right)|| To find the inflection point at the end of the rectangle, add the period to the |x|-coordinate of point |(h,k).| ||h+\color{#333fb1}p=-\dfrac{3\pi}{4}+\color{#333fb1}{\dfrac{3\pi}{4} }=0|| So, the inflection point at the end of the cycle is at |(0,2).| Place another inflection point in the middle of the rectangle at |\left(-\dfrac{3\pi}{8},2\right).| Next it is separated into 4 equal parts.
Determine the variation and graph a first cycle
Since |a| and |b| have opposite signs, the function decreases at the start of the cycle.
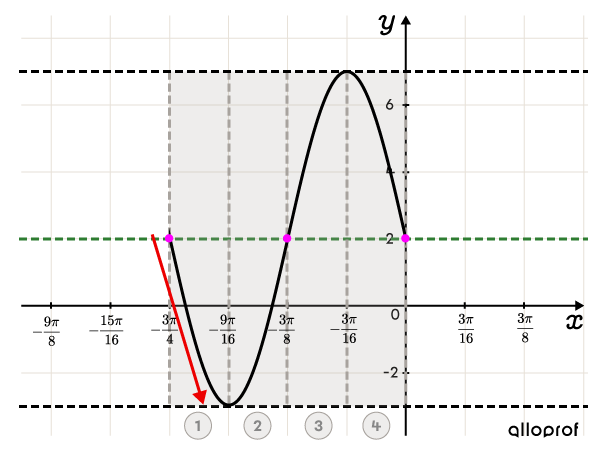
Graph the function by following the curve on the rest of the Cartesian plane

Moments in the video :