Subjects
Grades
Speed is the ratio between the change in position of a moving body and the time needed to make this change of position.
Speed is measured daily. For instance, when you travel by car or bus. In these cases, speed is measured in kilometres per hour |\text {(km/h)}.| However, for formulas used in physics, metres per second |\text {(m/s)}| is the preferred unit of measure.
The general equation used to calculate speed is:
|v=\displaystyle \frac{\triangle x}{\triangle t}|
where
|v| represents the moving object's speed |\text {(in m/s)}|
|\triangle x| represents the change in the object's position |\left( x_{f} - x_{i} \right)| |\text {(in m)}|
|\triangle t| represents the difference in time |\left( t_{f} - t_{i} \right)| |\text {(in s)}|
The formula in the box above is similar to calculating the slope of a straight line of a graph. In fact, by plotting the position of a moving body with respect to time, the slope of this graph can be calculated to determine the speed of the moving body.
From a graphical point of view, three types of relationship can be obtained.
|
When the graph of speed as a function of time results in a zero variation graph, the object is moving at a constant speed. The object is therefore moving in uniform rectilinear motion (URM). |
 |
| If the graph of speed vs. time shows a linear relationship, the object is accelerating (or decelerating). The object is therefore moving in a uniformly accelerated rectilinear motion (UARM). |
 |
| If the graph of speed vs. time shows a zero relationship superimposed on the x-axis, the object is motionless (stationary). |  |
There are two types of speed that can be determined from a graph:
To convert metres per second into kilometres per hour, follow the procedure below:
|\displaystyle \frac{\text {m}}{\text {s}} \times \frac {1 \text { km}}{1000 \text { m}} \times \frac {3600 \text { s}}{\text {h}}|
It is simpler, however, to just calculate:
|\displaystyle \frac{\text {m}}{\text {s}} \times 3.6 = \frac{\text {km}}{\text {h}}|
It's also possible to convert kilometres per hour into metres per second.
|\displaystyle \frac{\text {km}}{\text {h}} \times \frac {1000 \text { m}}{\text { km}} \times \frac {1 \text { h}}{3600 \text { s}}|
It is simpler, however, to just calculate:
|\displaystyle \frac{\text {km}}{\text {h}} \div 3.6 = \frac{\text {m}}{\text {s}}|
The average speed of a moving object is the ratio of its displacement to the time elapsed.
Average speed is not necessarily uniform between the start and end of a displacement: it represents what the speed would be between the start and endpoints if the speed were the same over the entire route.
A car stopped at a stop sign accelerates after making its compulsory stop. Its position is graphed in relation to time. What is the average speed of the car over the first five seconds of its displacement?
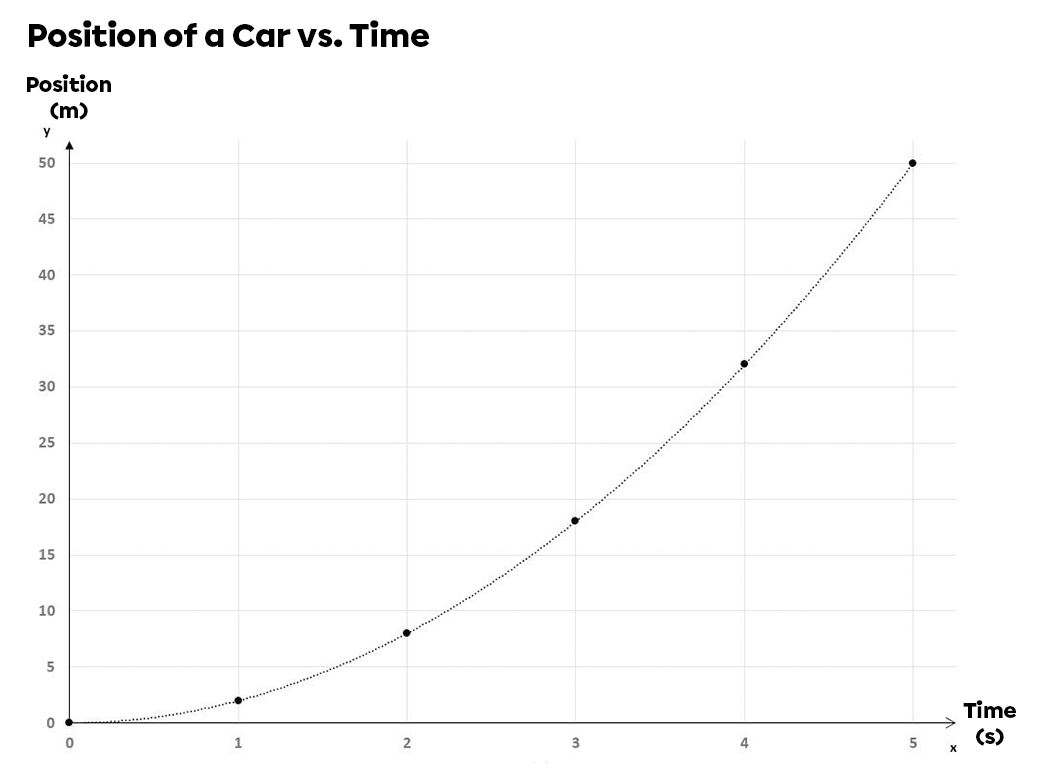
To find the average speed, we must determine the variation of position (overall displacement) and the change in time. The change in time is given, since the car has been moving for five seconds. From the graph, we see that the last point indicates that after five seconds, the car has travelled |\text {50 m}.| Using the formula for speed, we get:
\begin{align}v &= \frac{\Delta x}{\Delta t} \quad \Rightarrow \quad v = \frac{50 \: \text{m} - 0 \: \text{m}}{5 \: \text{s} - 0 \: \text{s}} \\&= 10 \: \text{m/s}\end{align}
The car therefore traveled at an average speed of |10 \: \text {m/s}| over the first five seconds of its journey.
In the example above, the average speed of the car was |10 \: \text {m/s}.| However, it's important to note that the car didn't always travel at a speed of |\small 10 \: \text {m/s}|: initially, when the car was stopped, its speed was zero. This means that the car's speed after five seconds was actually greater than |\small 10 \: \text {m/s},| so that the average speed could be the calculated value.
If you want to find a speed at a specific point in time, you need to use a different speed formula, that for instantaneous speed.
Instantaneous speed is the speed of a moving object at any given moment.
A car's speedometer can be used to determine its instantaneous speed. This measurement only serves to determine how fast the car is travelling at the moment when the speed is observed. It is impossible to know how fast the car will travel over its journey.
Instantaneous speed is calculated by graphing the slope of a position as a function of time.
If the graph of position in relation to time is a linear relationship, instantaneous speed is calculated by determining the slope of this graph.
Determine the instantaneous speed of the car's movement at 3 seconds.

If you graph the slope of this line, it will be superimposed on the straight line used to calculate average speed. So, when a position vs. time graph gives a linear relationship, the average speed and instantaneous speed are the same.
To calculate instantaneous speed:
\begin{align}v &= \frac{\Delta x}{\Delta t} \quad \Rightarrow \quad v = \frac{15 \: \text{m} - 0 \: \text{m}}{3 \: \text{s} - 0 \: \text{s}} \\&= 5 \: \text{m/s}\end{align}
On a graph that shows position versus time, a curved line represents an acceleration or a change in speed. Instantaneous speed can be calculated using the tangent of the curve at a given point. A tangent line is a straight line that passes through a single point on the curve.
Determine the instantaneous speed of this car's movement at 3 seconds.
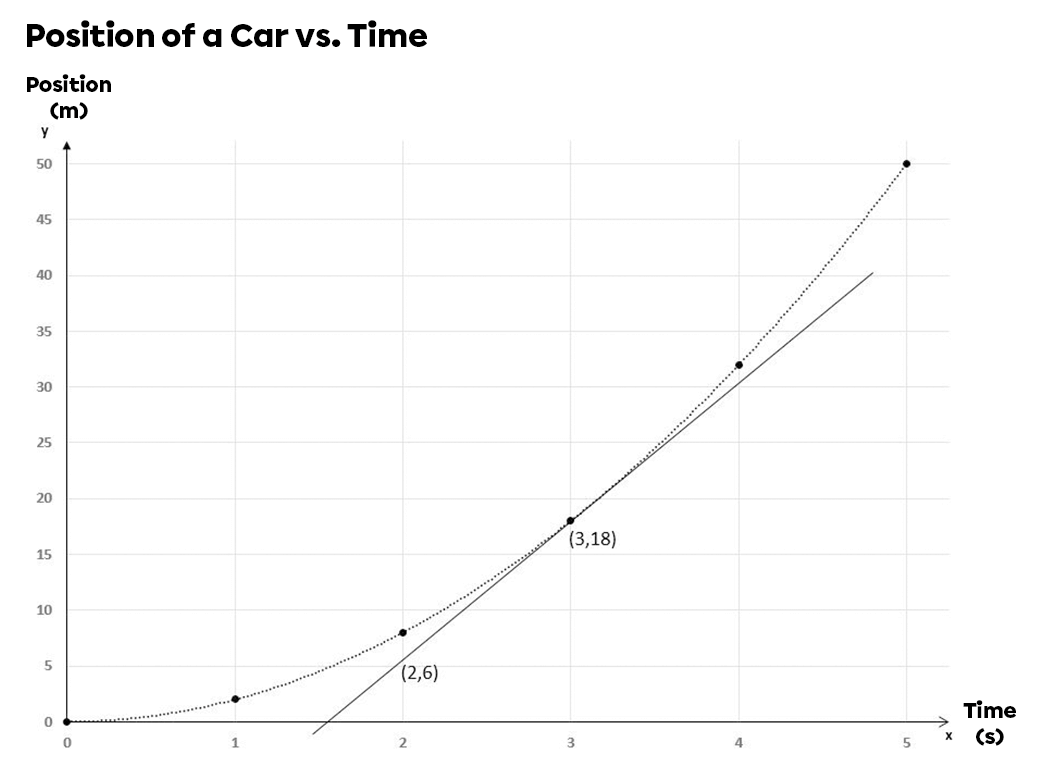
To determine the instantaneous speed, draw the tangent of the curve at the desired point, i.e. at three seconds. Next, choose two points on this line and calculate the instantaneous speed using the speed formula. For example, take the points |(2,6)| and | (3,18)| on the tangent line of the graph above.
||\begin{align}v = \displaystyle \frac {\triangle x}{\triangle t} \quad \Rightarrow \quad
v &= \displaystyle \frac {18 \: \text{m} - 6 \: \text{m}}{3 \: \text{s} - 2 \: \text{s}} \\
&= \displaystyle \frac {12 \: \text{m}}{1 \: \text{s}}\\
&= 12 \: \text{m/s} \end{align}||
The previously determined average speed of the car on this journey was |\text {10 m/s}.| Following the calculation of instantaneous speed, we can see that, from the third second onwards, the instantaneous speed is actually higher than this average speed.
The graph of speed vs. time indicates the speed of a moving object at any given moment. We can't tell where the object is by simply looking at the graph: however, we can determine its speed and the direction of movement.
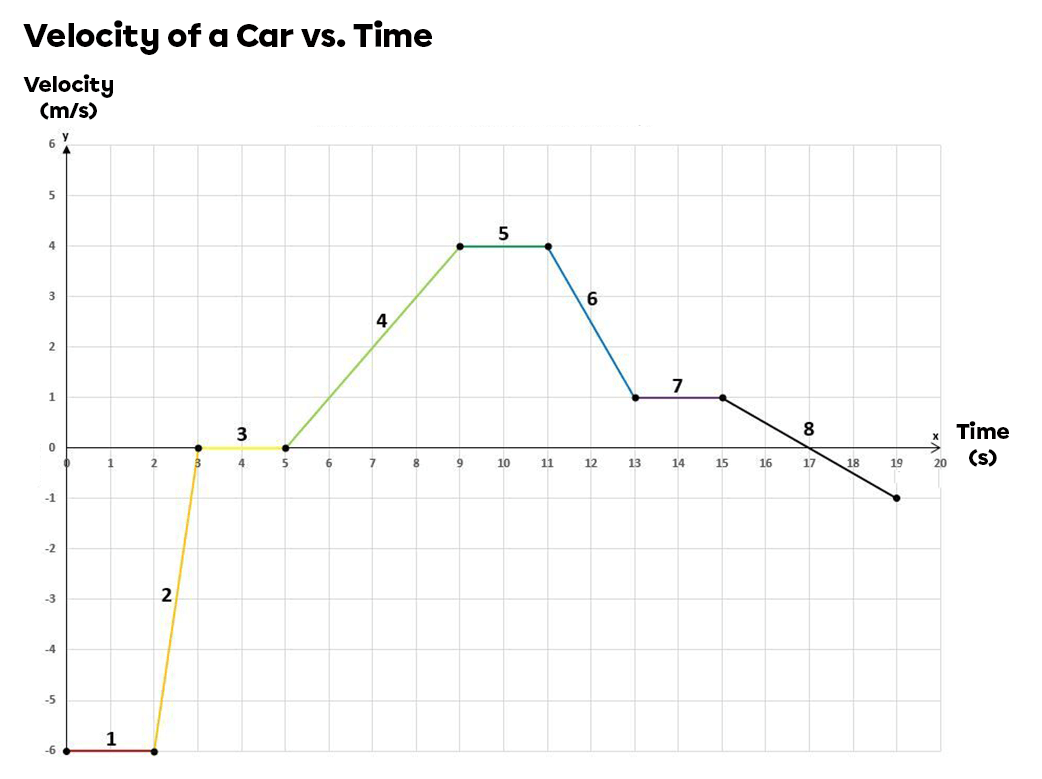
In a speed vs. time graph, the area under the curve indicates the distance the object has traveled within a time interval.
Calculate the change of position between the 11th and 13th seconds.
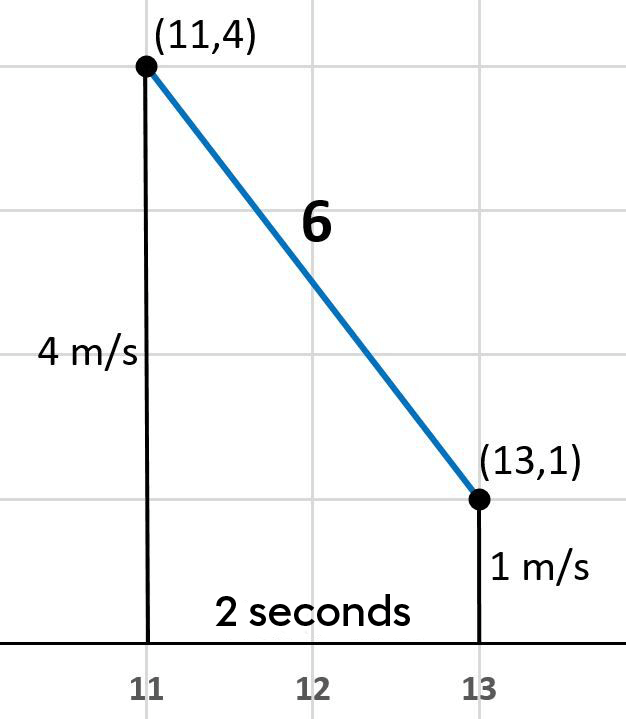
The area under the curve between the 11th and 13th seconds takes the shape of a trapezoid. We can use the formula for the area of a trapezoid to find the area under the curve.
\begin{align}A &= \frac{(B + b) \times h}{2} \\&= \frac{(4 \: \text{m/s} + 1 \: \text{m/s}) \times 2 \: \text{s}}{2} \\&= 5 \: \text{m}\end{align}
The object's variation of position between the eleventh and thirteenth seconds is |\text {5 m}.|
When the area under the curve is represented by a zone below the |x|-axis, a negative displacement is calculated. This negative value makes sense, since the speed below the |x|-axis is negative. We'll move to the negative side if the speed is negative. So it's very important to establish a clear reference system at the start of a problem.