Subjects
Grades
This concept sheet explains the steps to follow to properly use a spark timer.
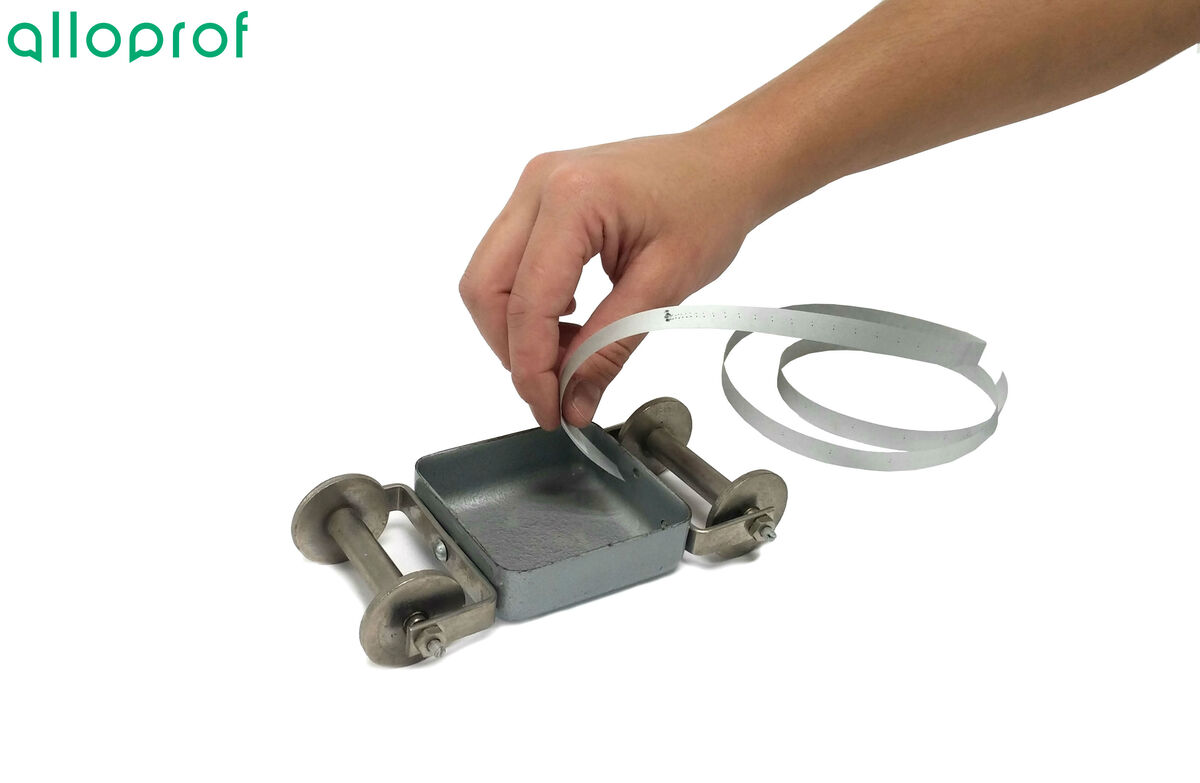
A spark timer is an instrument that allows the precise measurement of the position of an object: at definite time intervals, a spark is produced by the device, producing a dot on a recording paper tape.
By referring to these marks, it is possible to locate an object according to time. This instrument is particularly used when studying uniform rectilinear motion (URM), uniformly accelerated rectilinear motion (UARM), and free fall motion.
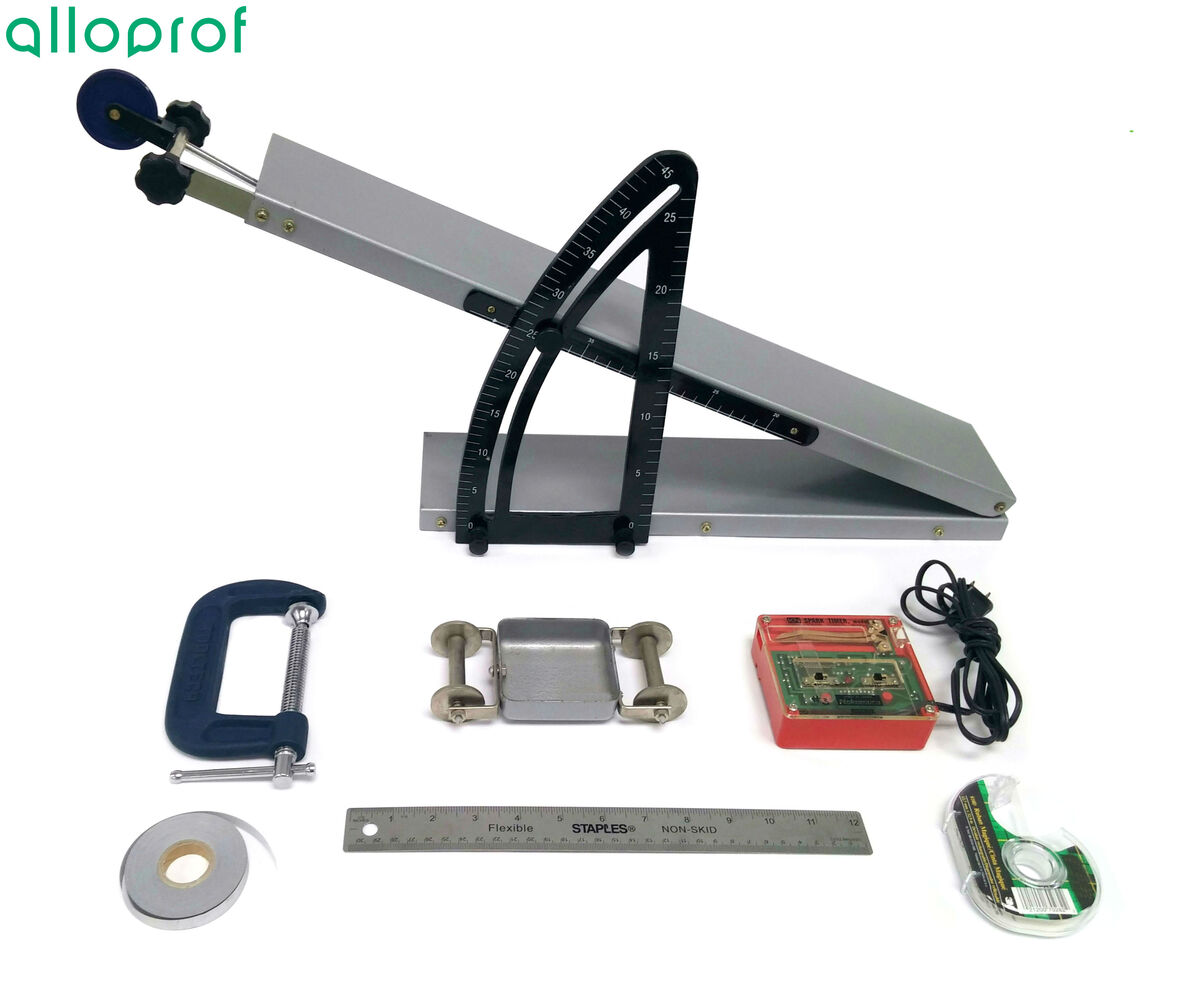
The equipment may vary according to the experiment carried out. The list below shows the essential equipment for determining the position of a cart according to time in UARM, performed on an inclined plane.
Spark timer
Recording paper tape
Adhesive tape
Cart
Inclined plane
Clamp
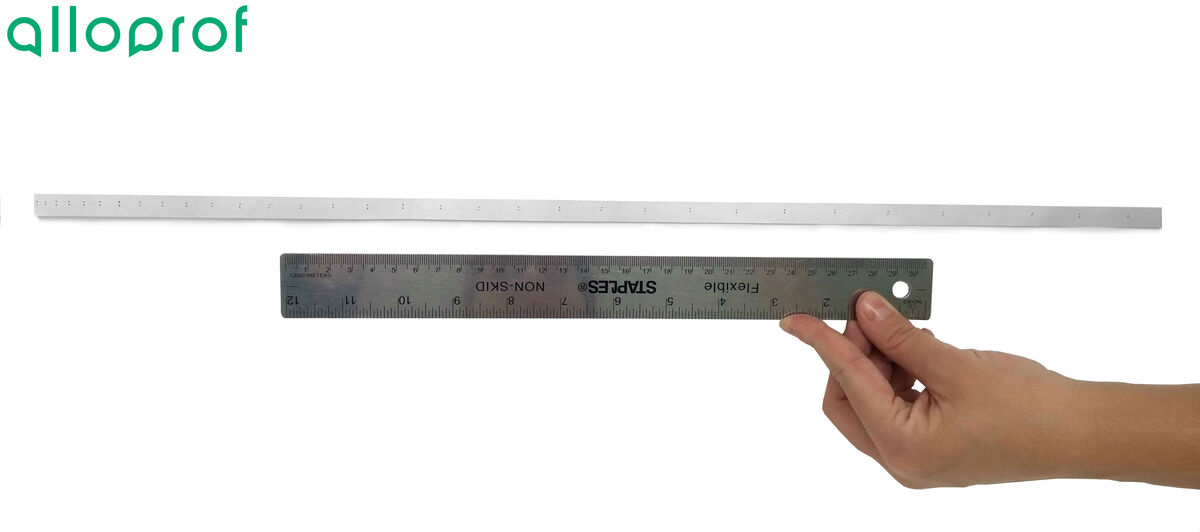
Ruler
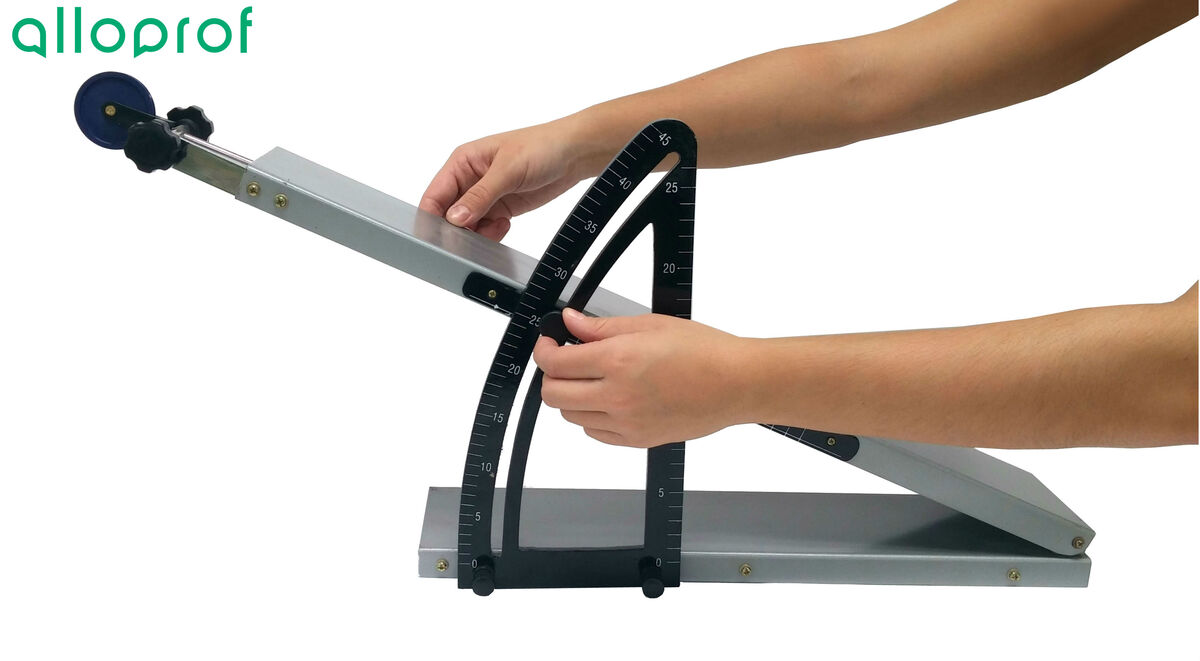
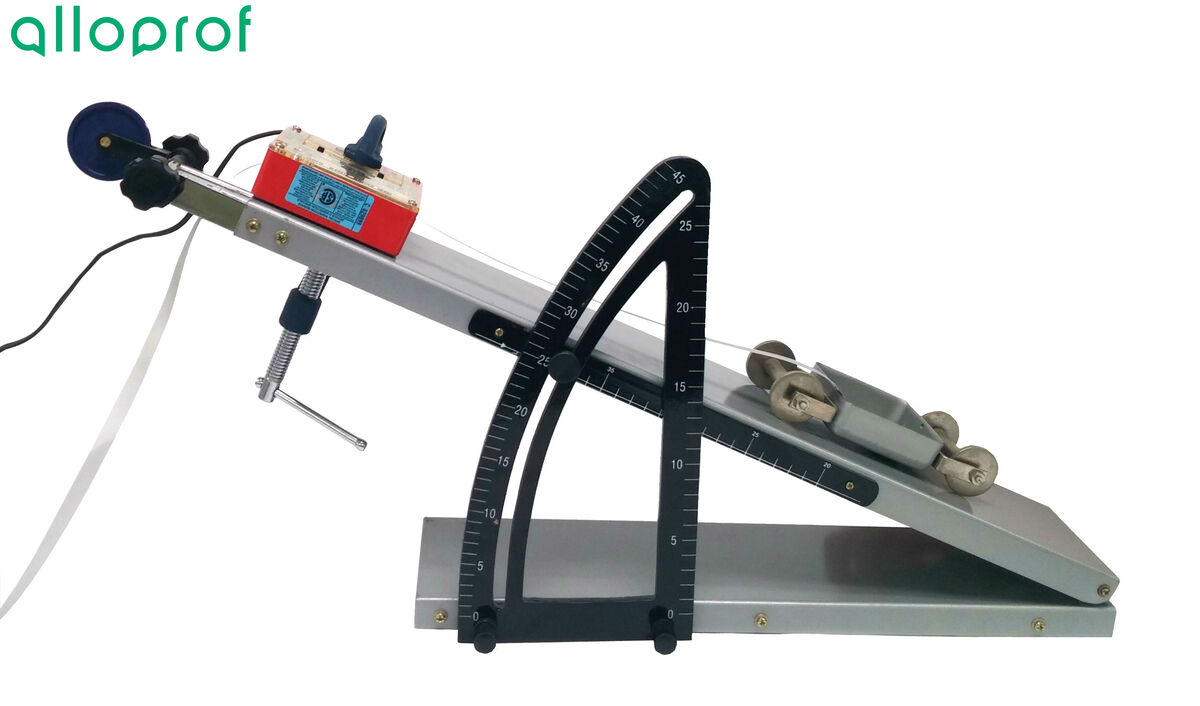
1. Adjust the inclined plane at a |25^{\circ}| angle.
2. Position the spark timer at the top of the inclined plane using the clamp.
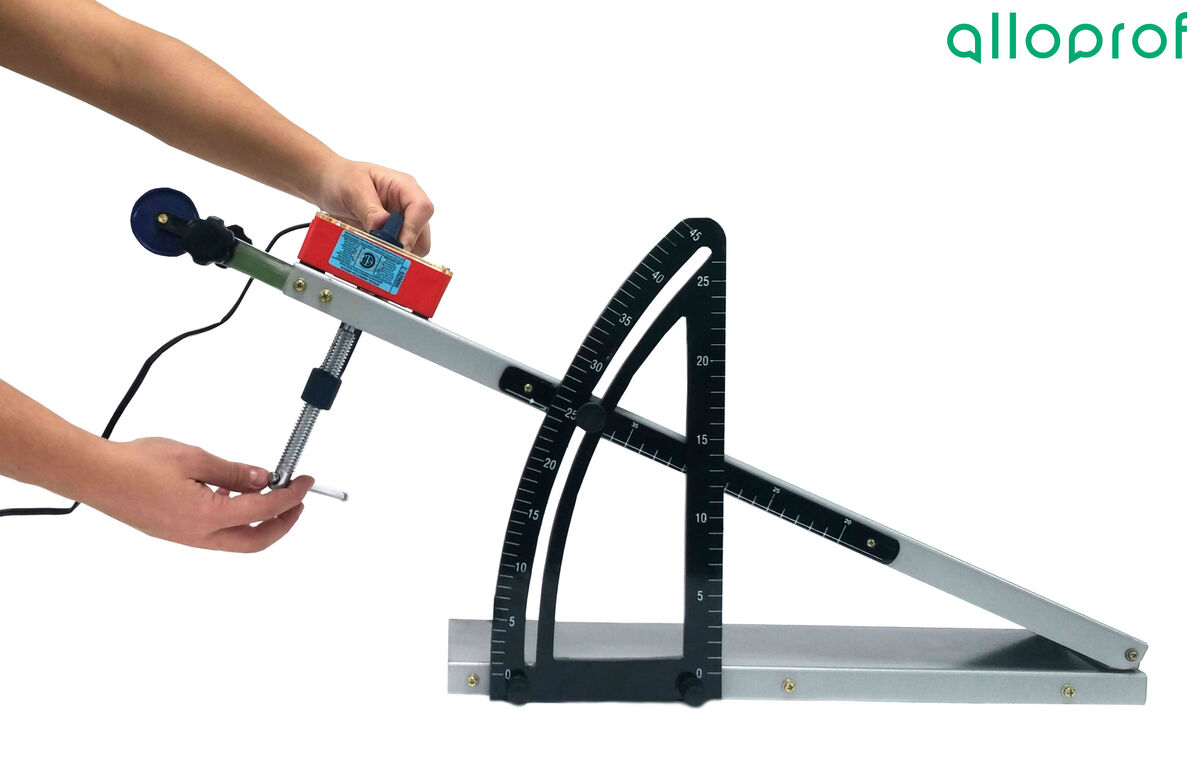
It is important to place the spark timer parallel to the direction of the motion produced by the cart. Otherwise, the dots on the recording paper tape may not accurately represent the motion of the cart.
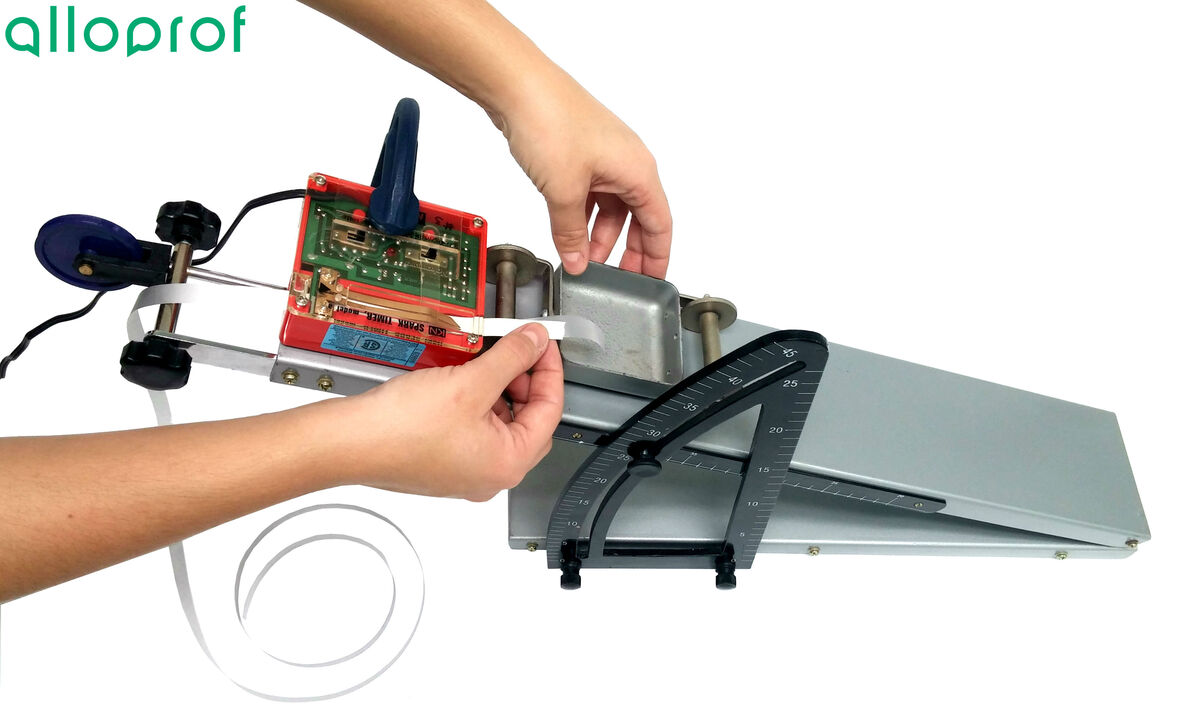
3. Cut a suitable length of recording paper tape and place it in the spark timer.
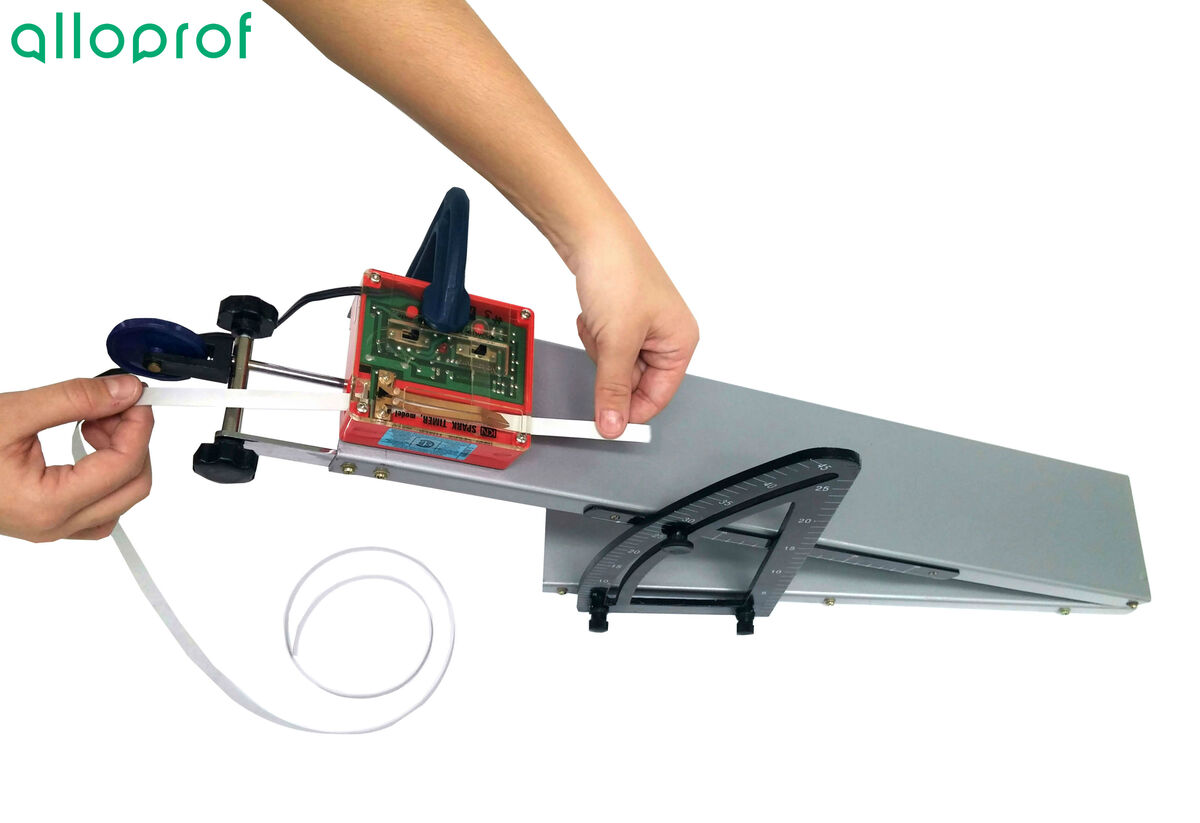
4. Using the adhesive tape, stick the recording paper tape onto the cart.
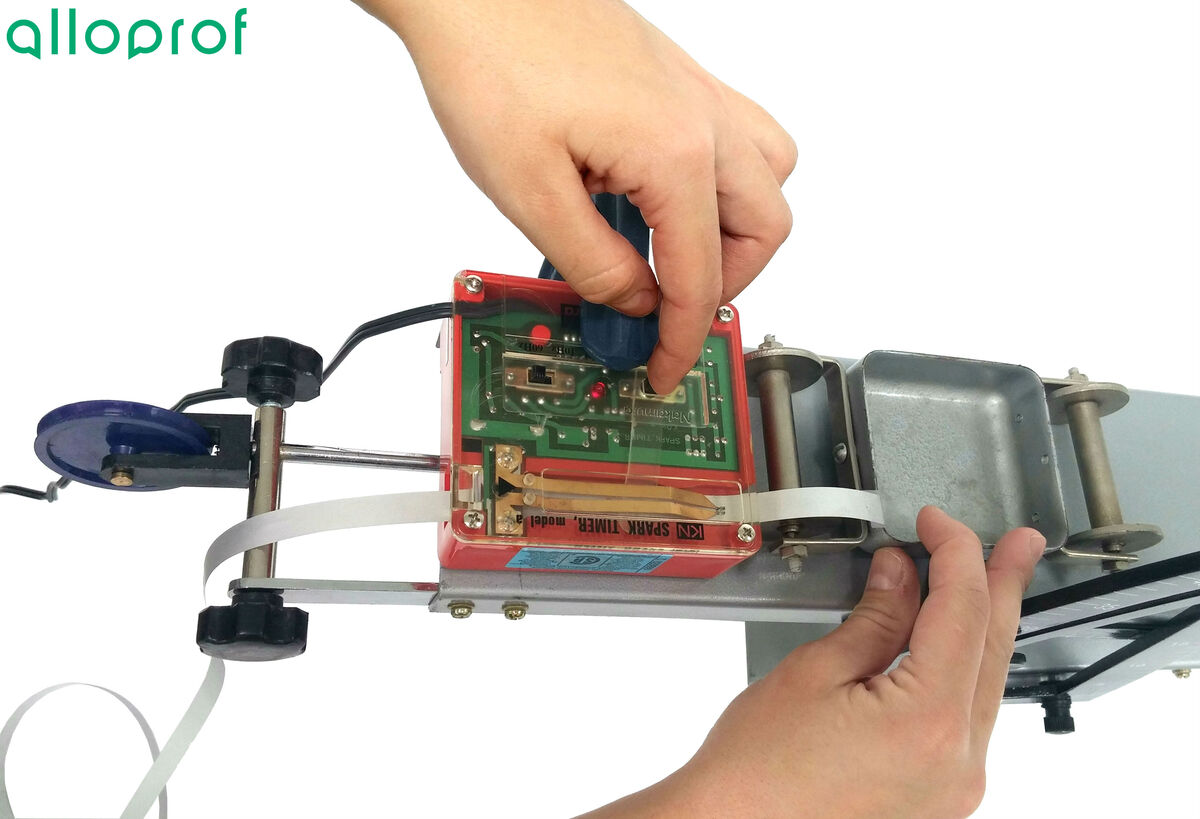
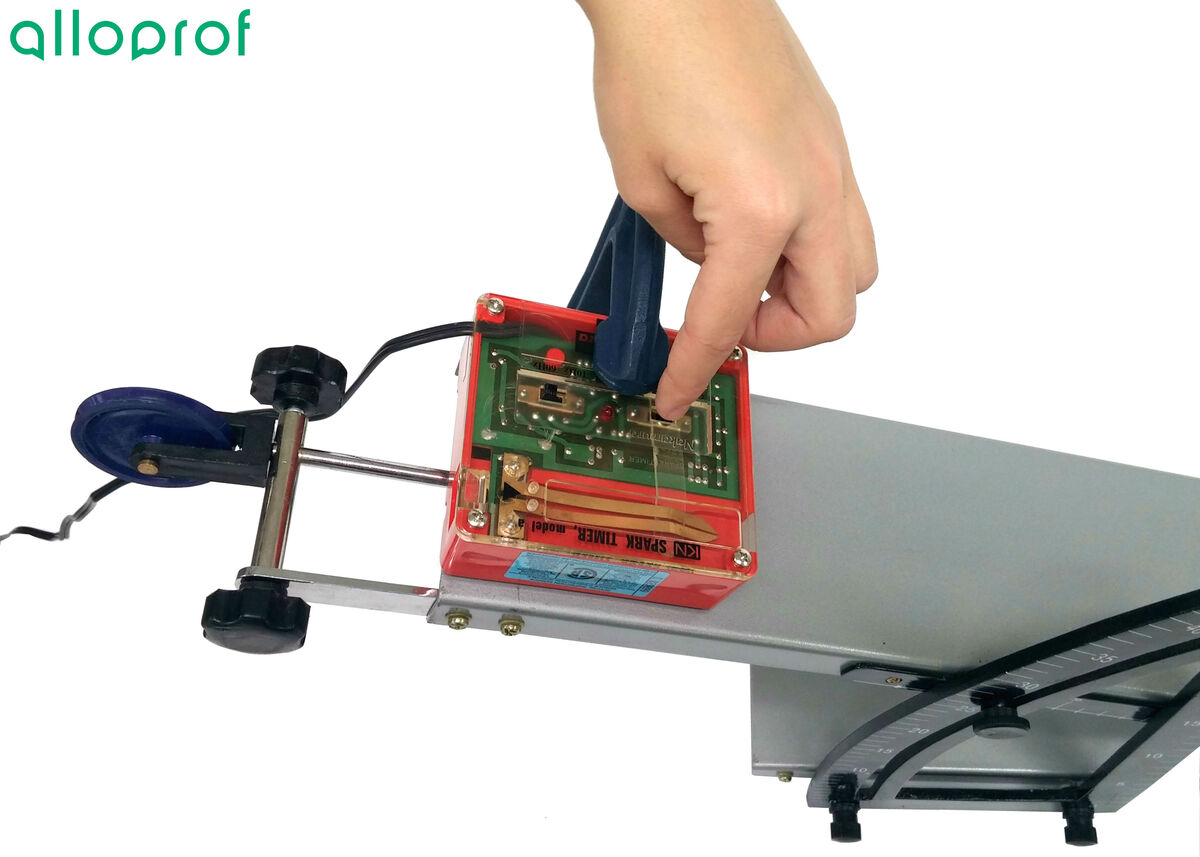
5. Plug in and start the spark timer.
6. Let go of the cart so that gravity drives it down the inclined plane.
7. Once the cart has completed its motion and comes to a stop, stop the spark timer.
8. Detach the recording paper tape from the cart and keep it aside to read out the data.
9. Put away the equipment.
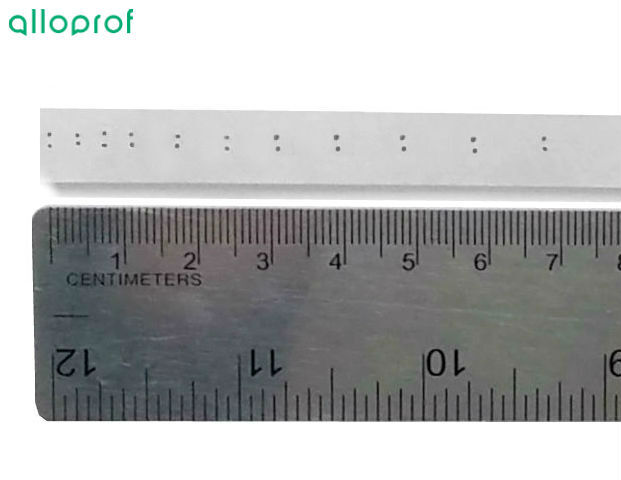
The recording paper tape will be marked with a series of dots located at varying distances from each other.
However, the time interval between two dots remains the same regardless of time registered on the paper tape. This time interval is related to the frequency of the device, which can vary between |10\ \text {Hz}| and |100\ \text {Hz}| . It is, therefore, important to note the frequency of the device in order to know the time interval between two dots.
A device with a frequency of |60\ \text {Hz}| will produce |60| dots on the recording paper tape every second. Thus, each dot is located at |\dfrac{1}{60}\ \text{s}| from the previous point.
A device with a frequency of |100\ \text {Hz}| will produce |100| dots per second on the recording paper tape. The time interval between each dot is, therefore, |\dfrac{1}{100}\ \text{s (0.01 s)}.|
After identifying the starting point, simply measure the distance between this dot and the next dot to know the absolute position of the cart according to time.
The results may be recorded in a results table similar to the one shown below.
Position of the cart in UARM on an inclined plane as a function of time
|
Time |\left( \text {s} \right)| |
Position |\left( \text {cm} \right)| |
|
|0| |
|0| |
|
|\dfrac{1}{60} = 0.01\overline{6}| |
|0.40| |
|
|\dfrac{2}{60} = 0.0\overline{3}| |
|0.70| |
|
|\dfrac{3}{60} = 0.05| |
|1.10| |
|
|\dfrac{4}{60} = 0.0\overline {6}| |
|1.70| |
|
|\dfrac{5}{60} = 0.08\overline{3}| |
|2.40| |
|
|\dfrac{6}{60} = 0.10| |
|3.10| |
|
|\dfrac{7}{60} = 0.11\overline{6}| |
|3.90| |
|
|\dfrac{8}{60} = 0.1\overline{3}| |
|4.80| |
|
|\dfrac{9}{60} = 0.15| |
|5.80| |
|
|\dfrac{10}{60} = 0.1\overline{6}| |
|6.80| |
From this data, it is possible to plot a graph of the position according to time. The analysis of this graph and the data allows the deduction of important information related to the speed (average or instantaneous) and to the acceleration of an object.