Subjects
Grades
It is possible to plot a tangent function in a Cartesian plane given its equation. To plot the function, follow these steps:
Draw the inflection point |(h,k).|
Find the period of the function |\left(\text{period}=\dfrac{\pi}{{\mid}b{\mid}}\right).|
Calculate the equations of the asymptotes located to the left and to the right of the inflection point |\left(x=h\pm\dfrac{\text{period}}{2}\right)| and plot the 2 asymptotes.
Determine if the function is increasing |(ab>0)| or decreasing |(ab<0).|
Locate a few additional points, if necessary.
Plot the function.
Plot the graph of the function |f(x)=2\tan\big(3(x-1)\big)+4.|
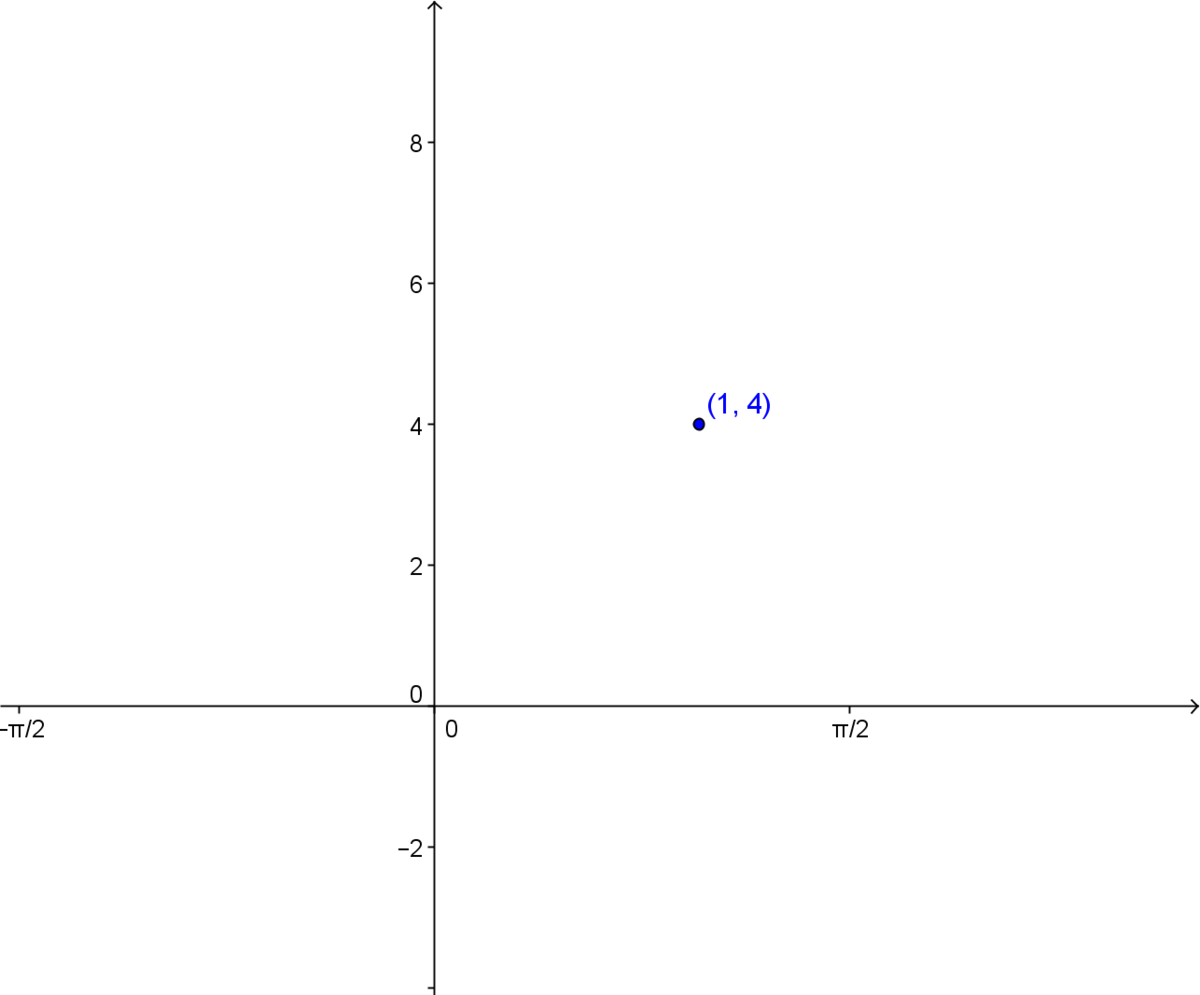
1. Plot the inflection point
The coordinates of the inflection point are |(h,k)=(1,4).|
2. Find the period of the function
The period of the function is calculated as follows: ||P = \dfrac{\pi}{{\mid}b{\mid}} = \dfrac{\pi}{{\mid} 3 {\mid} } = \dfrac{\pi}{3}||
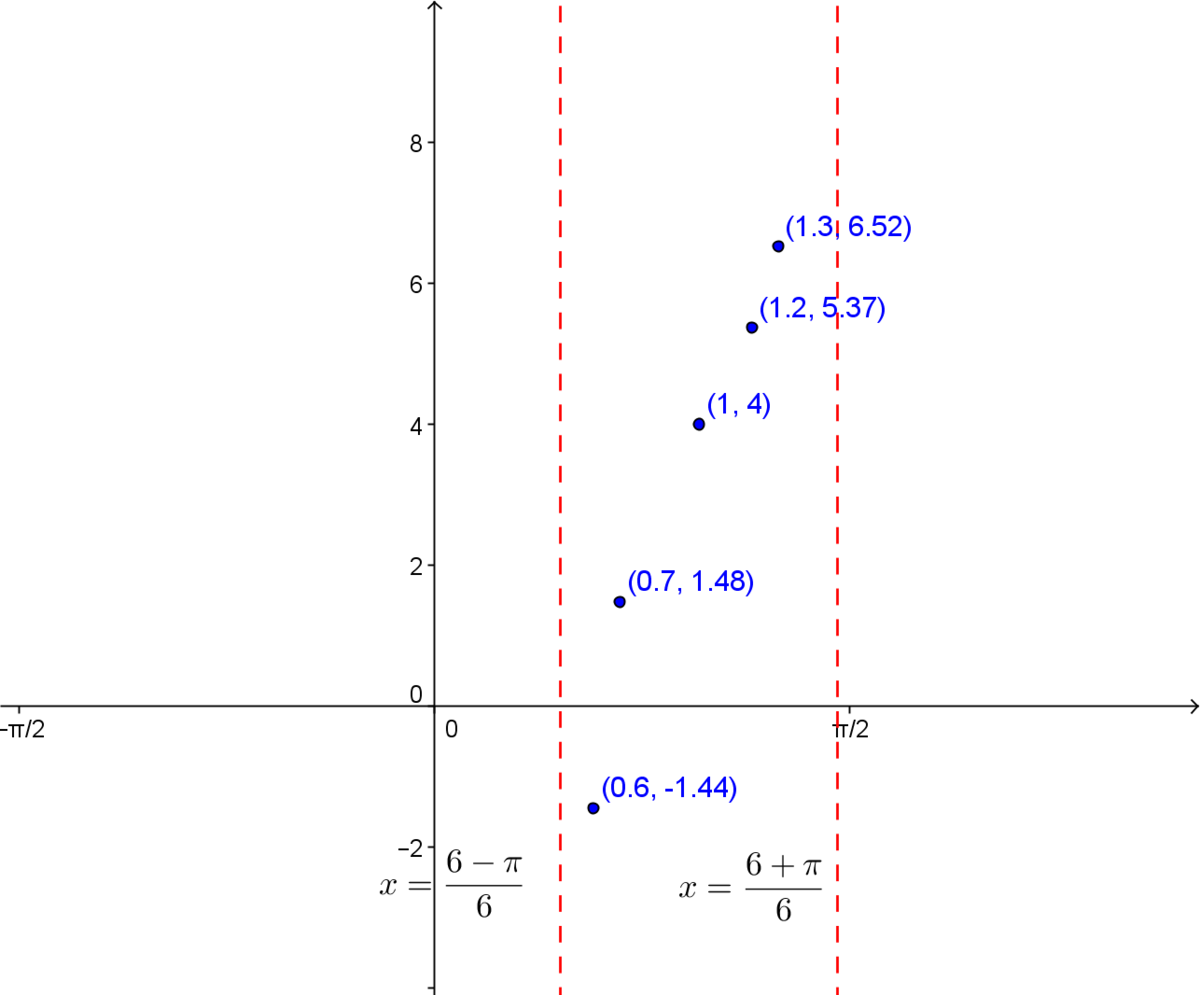
3. Calculate the equations of the asymptotes located to the left and to the right of the inflection point and plot the 2 asymptotes
The equation of the asymptote to the left of the point |(h,k)| is calculated as follows: ||x = 1 - \dfrac{\dfrac{\pi}{3}}{2} = 1-\dfrac{\pi}{6} = \dfrac{6-\pi}{6}||
The equation of the asymptote to the right of the point |(h,k)| is calculated as follows: || x = 1 + \dfrac{\dfrac{\pi}{3}}{2} = 1+\dfrac{\pi}{6}= \dfrac{6+\pi}{6}||

4. Determine if the function is increasing or decreasing
The product |ab| is positive, so the function is increasing, as |2 \times 3 >0.|
5. Plot a few additional points, if necessary
To find other points, make a table of values.
| |x| | |y| |
|---|---|
| |0{.}6| | |-1{.}14| |
| |0{.}7| | |1{.}48| |
| |1{.}2| | |5{.}37| |
| |1{.}3| | |6{.}52| |
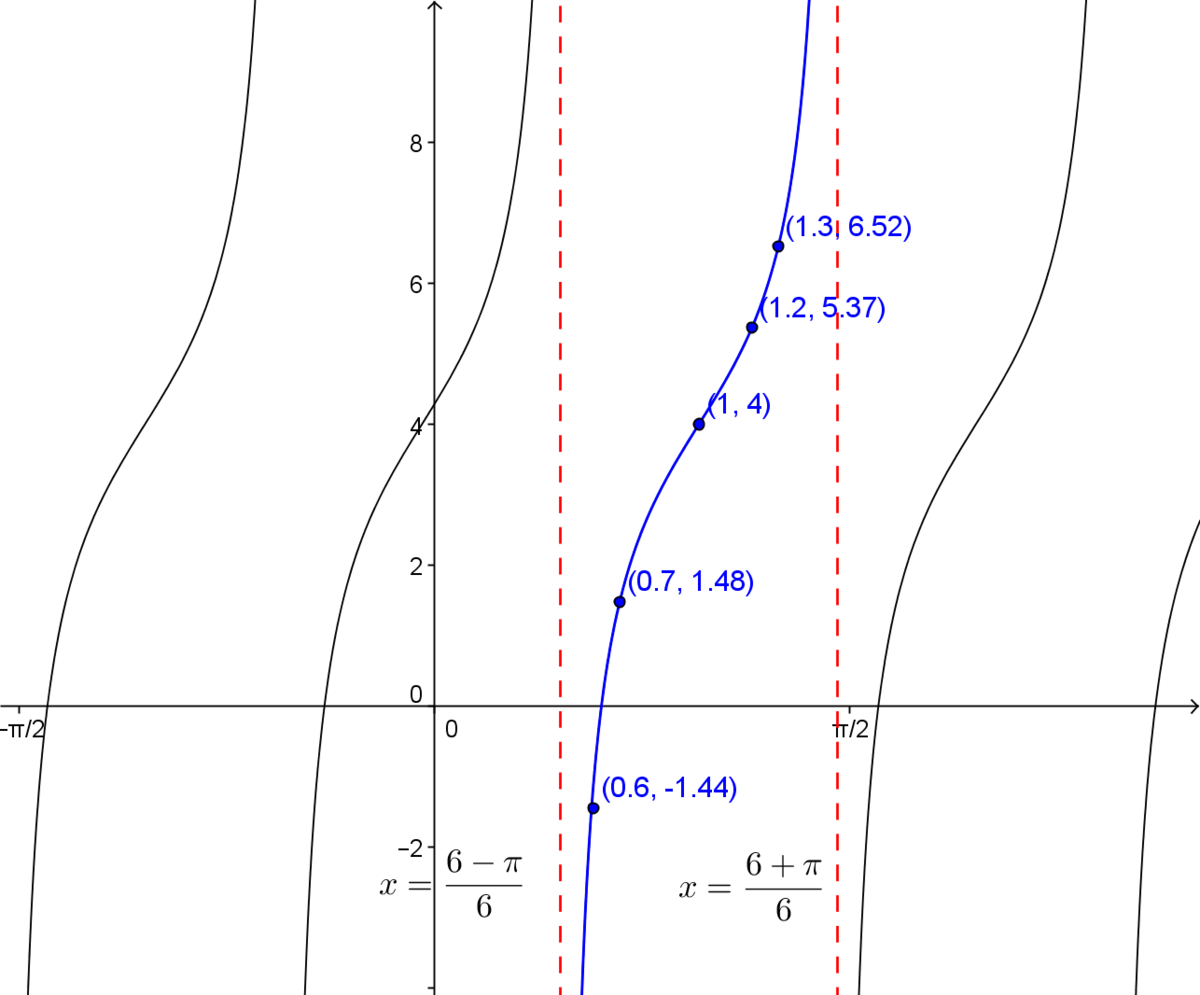
6. Plot the function
There is a second way to plot a transformed tangent function in a Cartesian plane, by using the parameters |a,| |b,| |h|, and |k| in its equation. To plot the function, follow these steps:
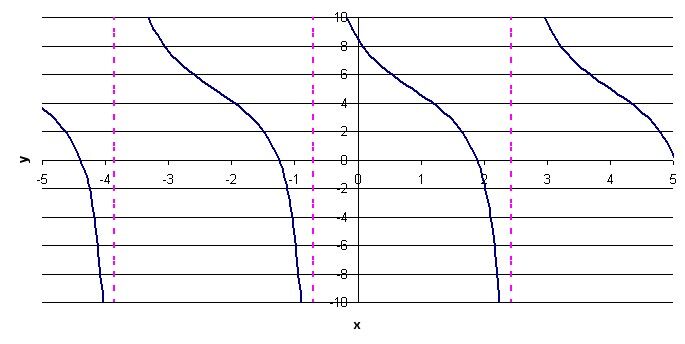
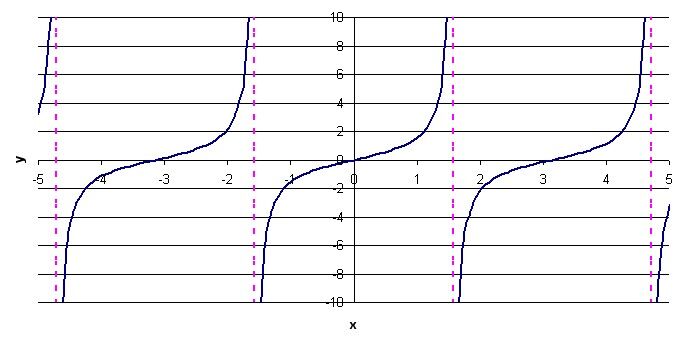
Plot the basic tangent function, i.e. |y = \tan(x).|
Apply the vertical stretching or compressing to the basic tangent function imposed by the parameter |a.|
Apply the horizontal scaling imposed by the parameter |b.|
Apply the horizontal translation imposed by the parameter |h.|
Apply the vertical translation imposed by the parameter |k.|
Note: The last four steps can be done in any order.
Plot the curve |y = -3 \tan \big(1(x - 4)\big) + 5| in a Cartesian plane.
1. Plot the basic tangent function
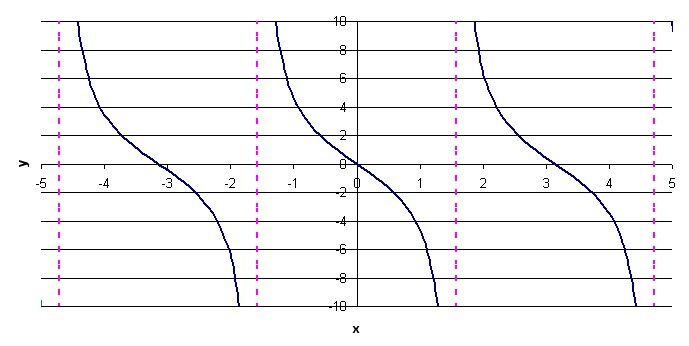
2. Apply the change imposed by the parameter |a|
The parameter |a| is equal to -3. Therefore, carry out a reflection across the x-axis and “stretch” the function vertically by a factor of 3. The following function is obtained.
3. Apply the change imposed by the parameter |b|
In this case, the parameter |b| is equal to 1. It is not necessary to change the horizontal scaling.
4. Apply the change imposed by the parameter |h|
In this case, the parameter |h| is equal to 4. Therefore, translate the function four units to the right.
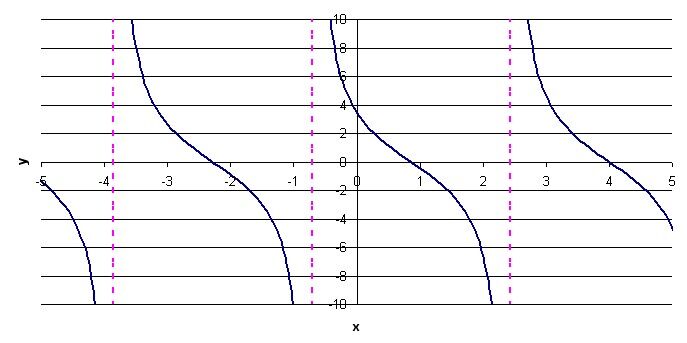
5. Apply the change imposed by the parameter |k|
In this case, the parameter |k| is equal to 5. Therefore, translate the function five units upwards.