Subjects
Grades
Operations on functions are performed the same way as operations on numbers are performed.
Given two real functions |f| and |g,| the quotient between them is defined as:||\left(\frac{f}{g}\right)(x)= f(x) \div g(x)||
The domain of the quotient function corresponds to the intersection of the domains of the functions in question. If there is a denominator, the restrictions on the latter must be excluded from the final domain.
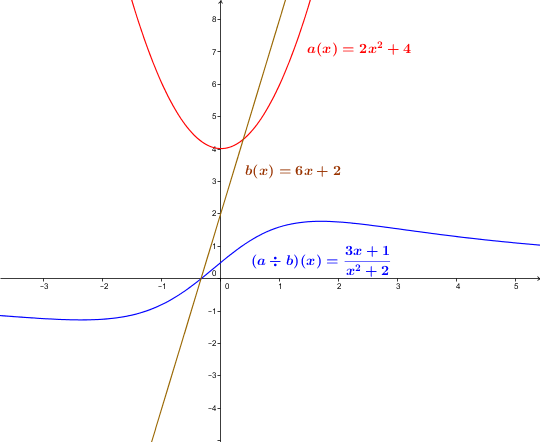
Function |a| is defined by |a(x)=6x+2| and function |b| is defined by |b(x)=2x^{2}+4.| ||\begin{align} \left(\dfrac{a}{b}\right)(x) &= a(x)\div b(x)\quad \text{where}\ b(x)\neq0 \\ &=\dfrac{6x+2}{2x^{2}+4} \\ &=\dfrac{2(3x+1)}{2(x^{2}+2)} \\ &= \dfrac{(3x+1)}{(x^{2}+2)} \end{align}||
The domain of function |a| corresponds to |\mathbb{R}.| The domain of function |b| also corresponds to |\mathbb{R}.| The domain of the function given by |\left(\dfrac{a}{b}\right)| will correspond to the intersection of the two initial domains by removing the values that cancel out the function |b.| However, function |b| is strictly positive, so it never cancels out. Thus, the function’s domain will be |\mathbb{R}.|
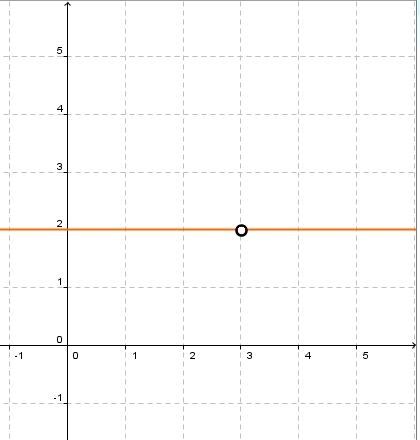
Function |m| is defined by |m(x)=2x-6| and function |n| is defined by |n(x)=x-3.| ||\begin{align} \left(\dfrac{m}{n}\right)(x) &= m(x)\div n(x)\quad \text{where}\ n(x)\neq0 \\ &=\dfrac{2x-6}{x-3} \\ &=\dfrac{2(x-3)}{(x-3)} \\ &= 2 \end{align}||
The domain of function |m| corresponds to |\mathbb{R}|. The domain of function |n| also corresponds to |\mathbb{R}.| The domain of the function given by |\dfrac{m}{n}| will correspond to the intersection of the two initial domains. From this intersection, we need to remove the values that cancel the function |n.| Function |n| becomes zero when |x=3.| Therefore, the domain of the function given by |\dfrac{m}{n}| will be |\mathbb{R} \backslash \lbrace 3 \rbrace.|
The domain of the function given by |\dfrac{m}{n}| will remain |\mathbb{R} \backslash \lbrace 3 \rbrace| after simplification.
To find the quotient of polynomial functions in a graph, divide the range of the first function by the range of the second function.
To produce the graph, create a table of values or use the peculiarities of the resulting function.
In the first example, a table of values of the functions |a(x)=6x+2,| |b(x)=2x^{2}+4| and the quotient of the |2| functions results in:
| |x| | |a(x)| | |b(x)| | |a(x)\div b(x)| |
|---|---|---|---|
| |0| | |2| | |4| | |\dfrac{1}{2}| |
| |1| | |8| | |6| | |\dfrac{4}{3}| |
| |2| | |14| | |12| | |\dfrac{7}{6}| |
| |3| | |20| | |22| | |\dfrac{10}{11}| |
| |4| | |26| | |36| | |\dfrac{13}{28}| |
Here is the graphical representation of Example 1:
Here is the graphical representation of Example 2. It is important to remember the restrictions when sketching the quotient of the two functions.