Matières
Niveaux
Reading guides are printed or electronic worksheets used by readers to:
take notes
organize information
visually identify key elements
They can be used for personal readings as well as for assigned readings.
According to their format, they can be used before, while and/or after reading:
Using reading guides is an effective strategy for improving reading skills.
Reading guides allow readers to:
ask themselves important comprehension questions.
monitor their comprehension of texts.
identify the key elements of texts.
clearly organize the ideas presented in texts.
think about the information they are reading.
There are several formats of reading guides.
Each format can be adapted according to:
the reading purpose
the type of reading
Fiction reading guides often include:
character descriptions
story events (listings & descriptions)
story themes & symbols
vocabulary definitions
thoughts and notes
Nonfiction reading guides often contain:
important information
summaries
thoughts and notes
comparisons between concepts/ideas
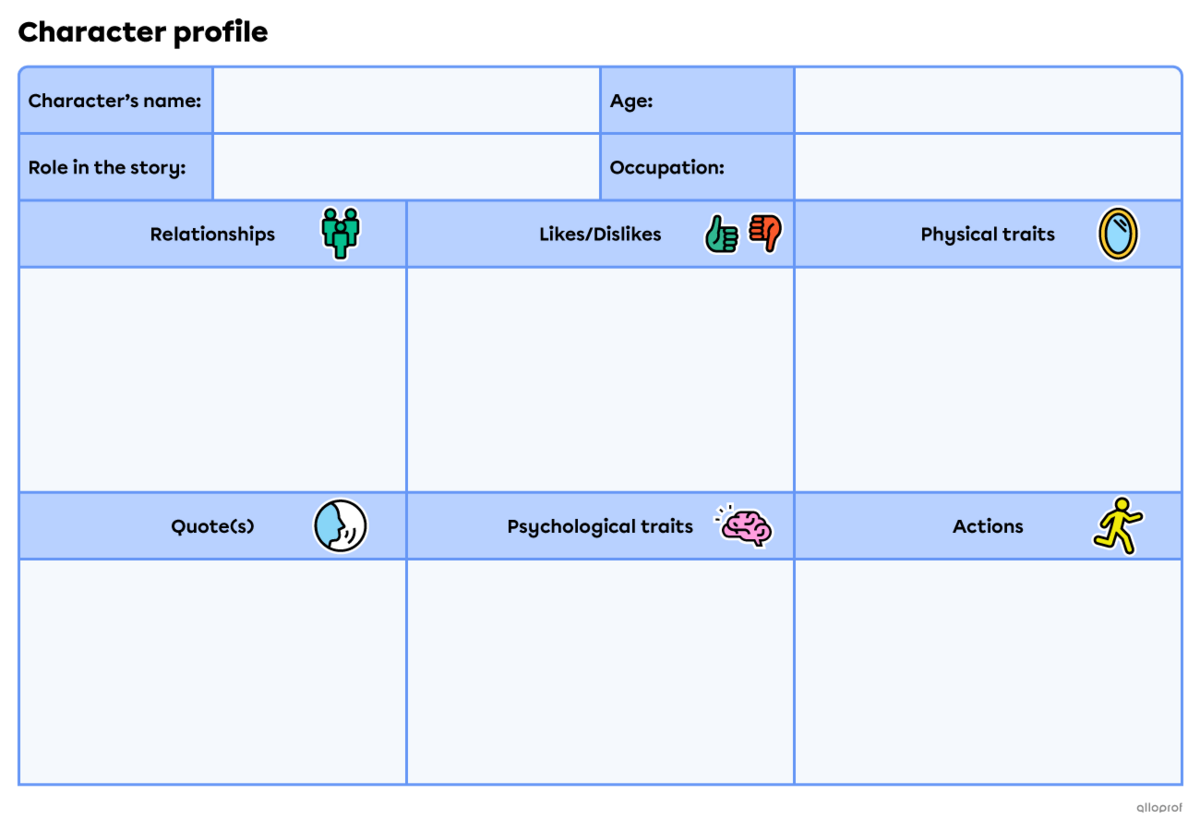
Character profiles in reading guides are used to note down information about a fictional character.
What is usually found in character profile worksheets:
Name of the character
Age
Role in the story: protagonist, antagonist, sidekick
Occupation
Relationships to other characters
Character-defining quote(s)
Likes/dislikes
Psychological traits
Physical traits
Character-defining actions
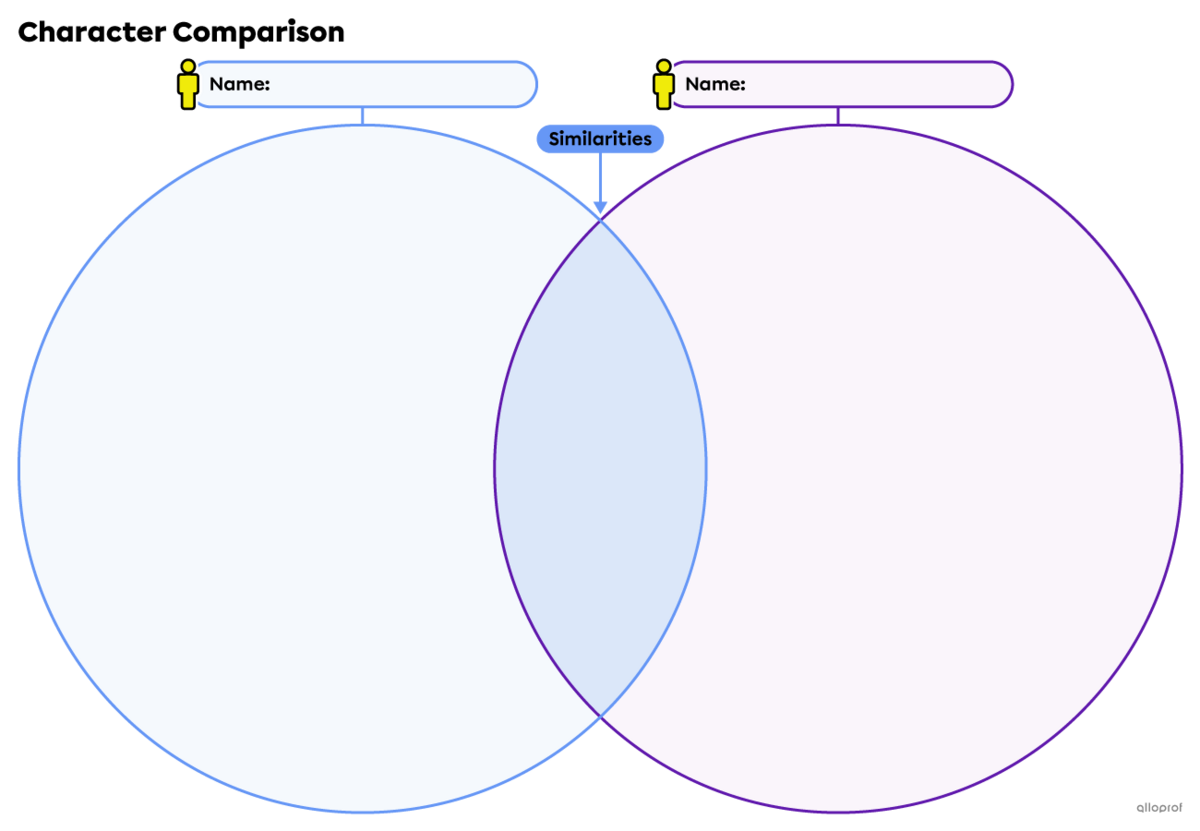
Reading guides can also be used to compare characters.
Here is an example of a Venn diagram used to compare the features of two story characters.
Here are things that can be compared:
Physical traits
Psychological traits
Background
Beliefs/Values
Behaviours/Ways to express themselves
Relationships
Dialogue
Timelines* can be used as reading guides to note down the progress of:
a story by ordering the key events.
a character’s actions in a story (to illustrate character growth).
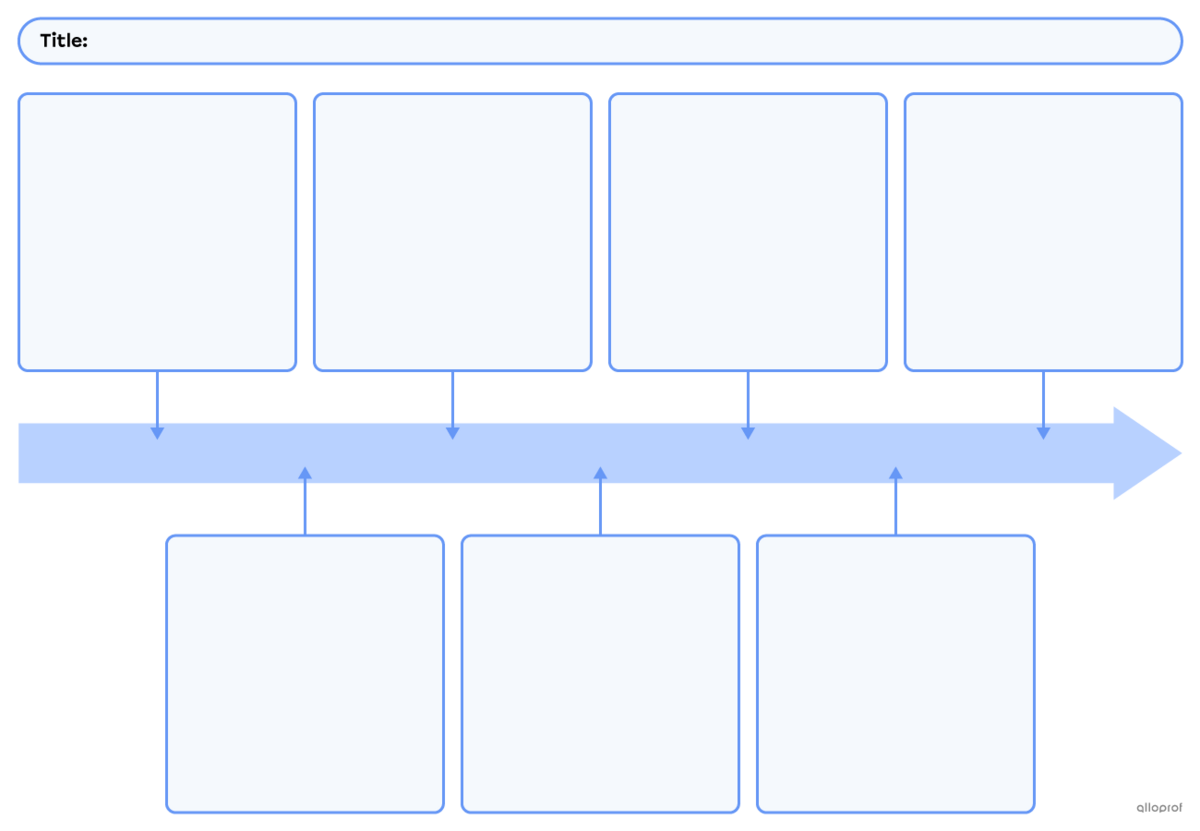
*Timelines can also be used with nonfiction texts to order historical events, instructions and progression.
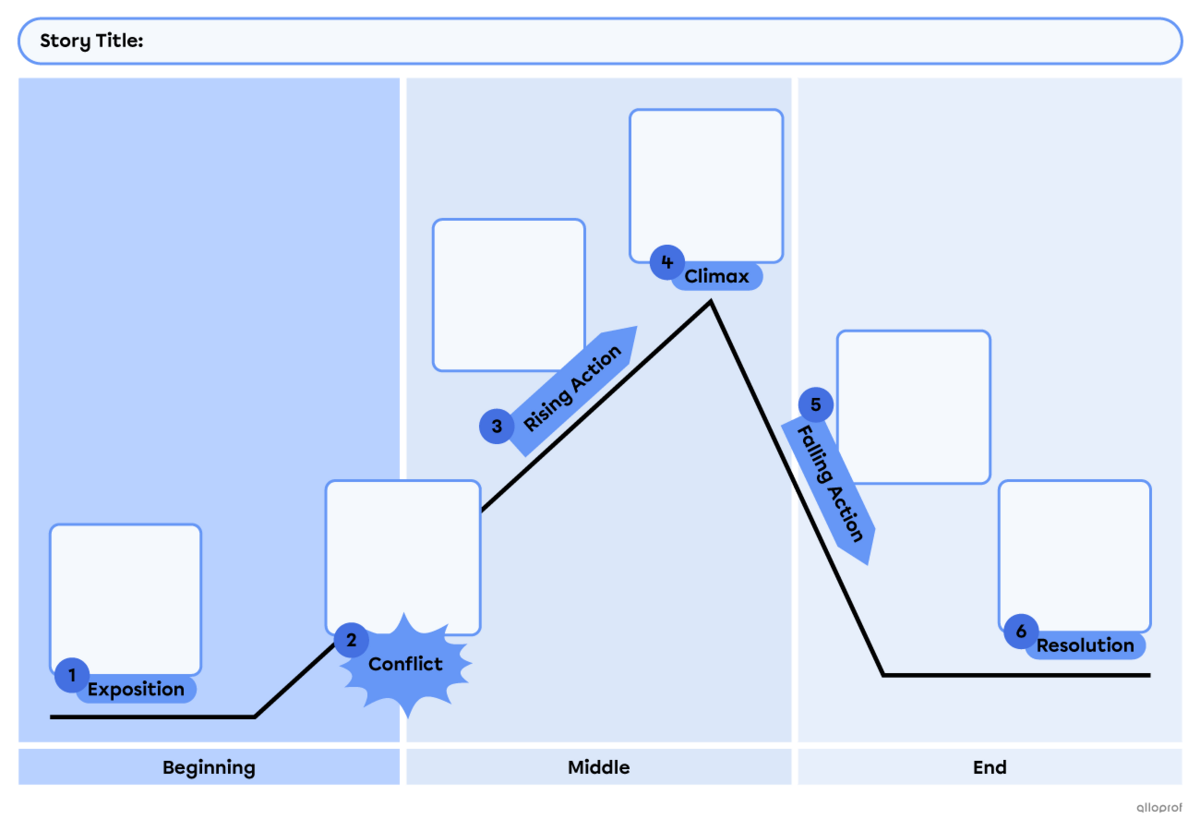
Reading guides can be used to understand the main events of a story.
A Plot diagram is an effective tool to visually organize and understand the six main stages of a story:
Exposition: introduction
Conflict: disturbing element
Rising action: events building suspense
Climax: point of no return
Falling action: results of climax
Resolution: conclusion
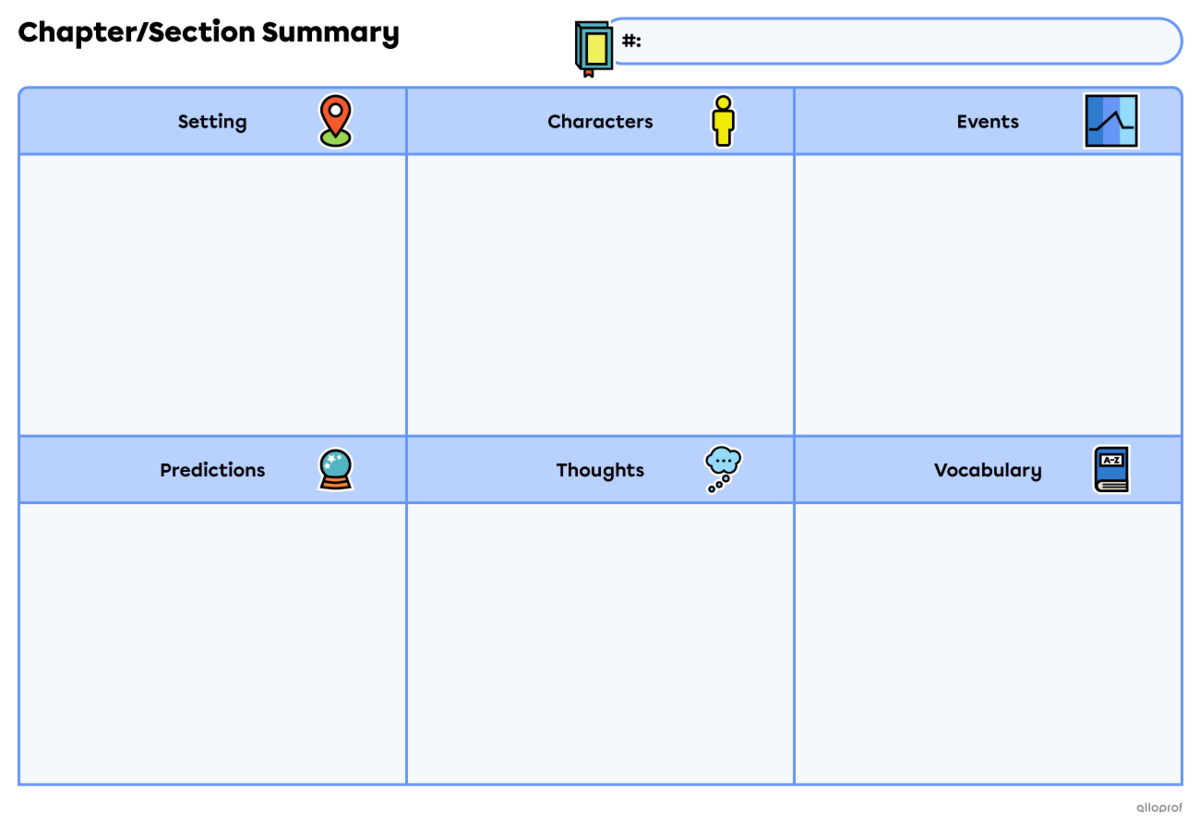
Reading guides can be used to summarize book chapters or sections.
What is usually found in chapter/section summaries:
Chapter/section number or title
Setting: location, time and context of the story
Characters: protagonist, antagonist, sidekicks
Vocabulary: important, learned, searched words
Events: plot points
Thoughts: opinion, interrogation and reactions
Predictions of what will happen in the next chapter.
Reading guides can be used to visually organize a book’s main information.
What is usually found in a book report worksheet:
Title
Author(s)
Genre(s): adventure, romance, science fiction…
Theme(s): central idea or topic of the story
Setting: location, time and context of the story
Plot: summary of key plot points
Characters: protagonist, antagonist, sidekicks
Thoughts: opinion, interrogation and reactions
Here is an example of a book report done with a concept map*.
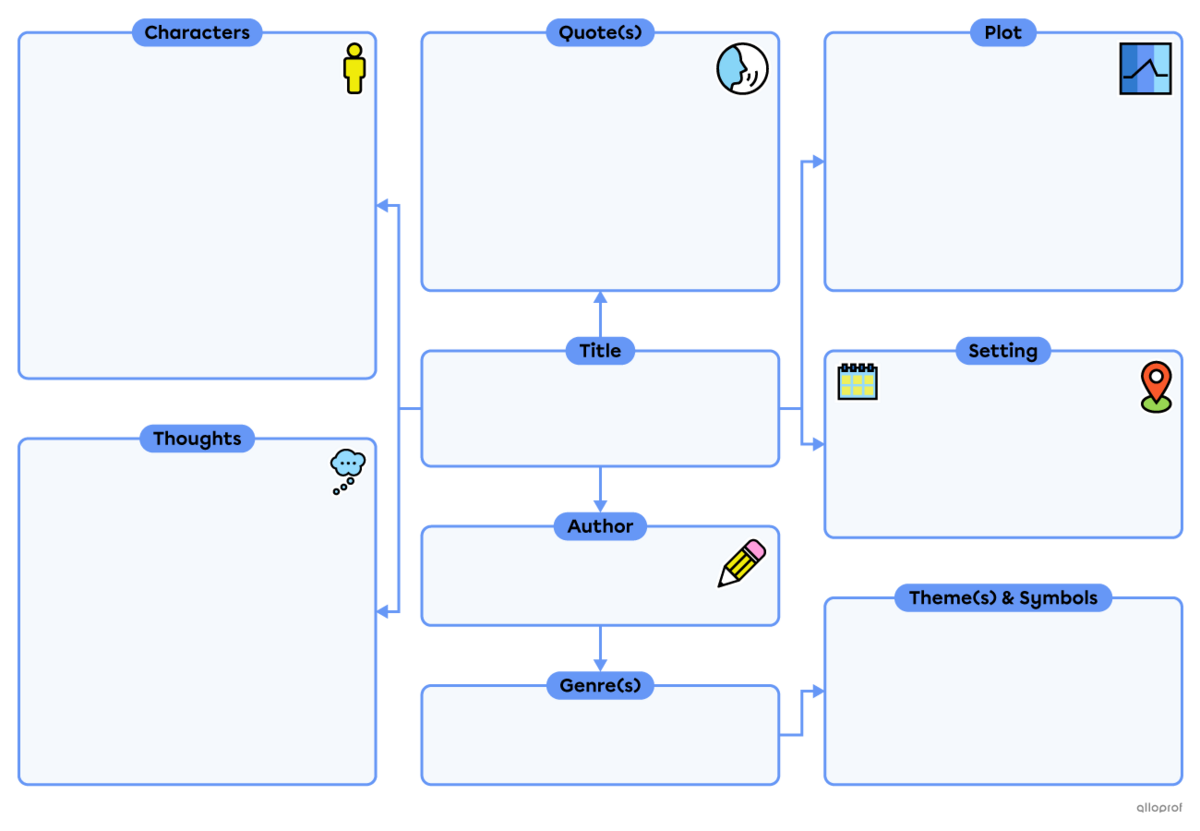
*Concept maps can also be used as nonfiction reading guides.
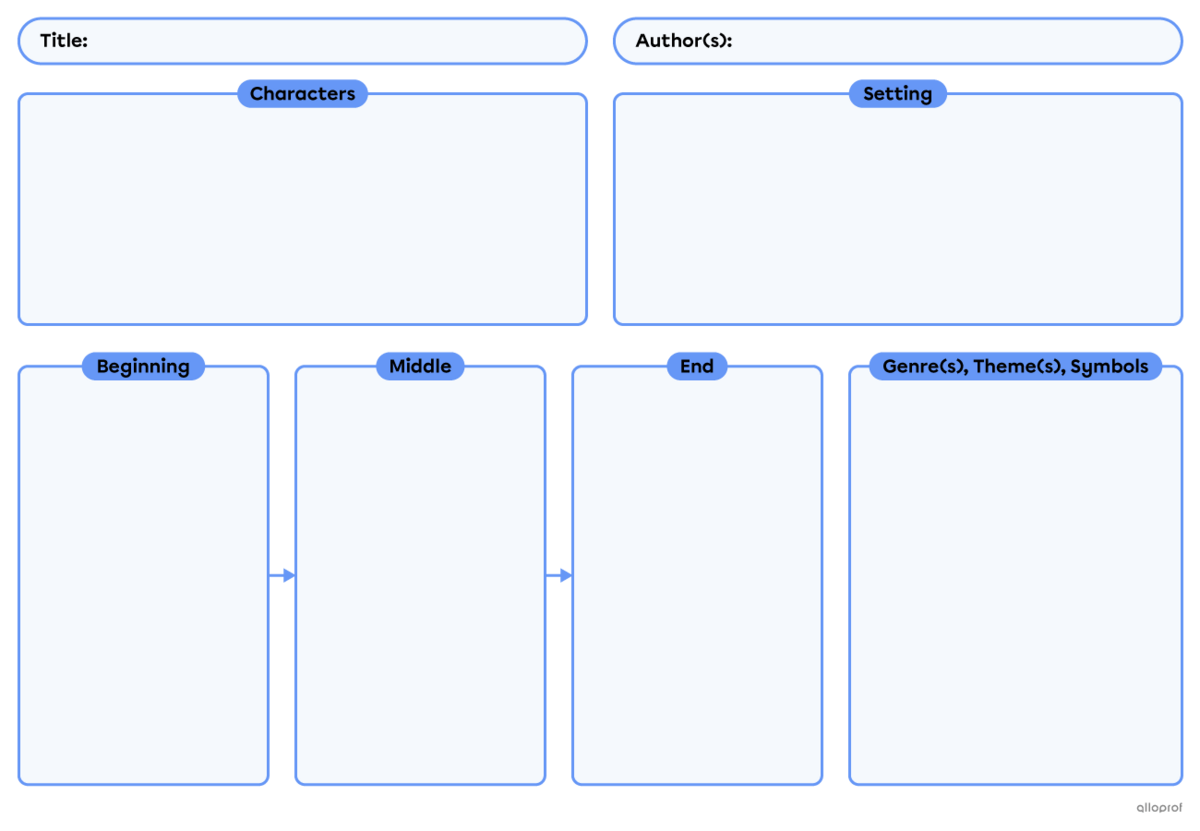
Here’s another example of a book report worksheet.
When reading nonfiction, there are several ways to take notes about a topic and organize the information found in the text.
Below are examples of reading guides that can facilitate note-taking.
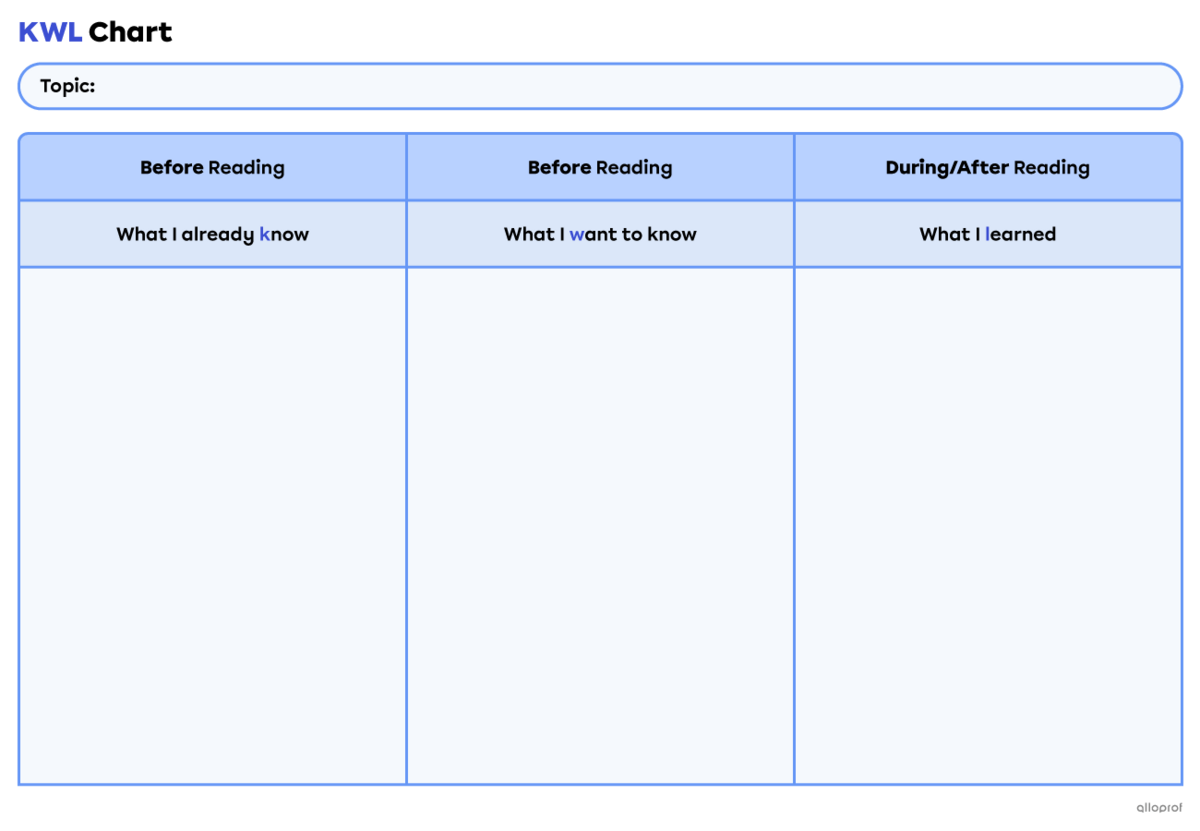
Using KWL charts is an effective way to take notes about a topic and organize information.
KWL charts are graphic organizers used before, during and after reading.
They contain three sections:
K: What I already know.
Before reading:
activate prior knowledge
write down what you already know about the topic
W: What I want to know.
Before reading:
reflect on what you would like to learn about the topic
write any questions you have about it
L: What I learned.
During and after reading:
note down relevant information about the topic.
complete the chart by writing down what you learned.
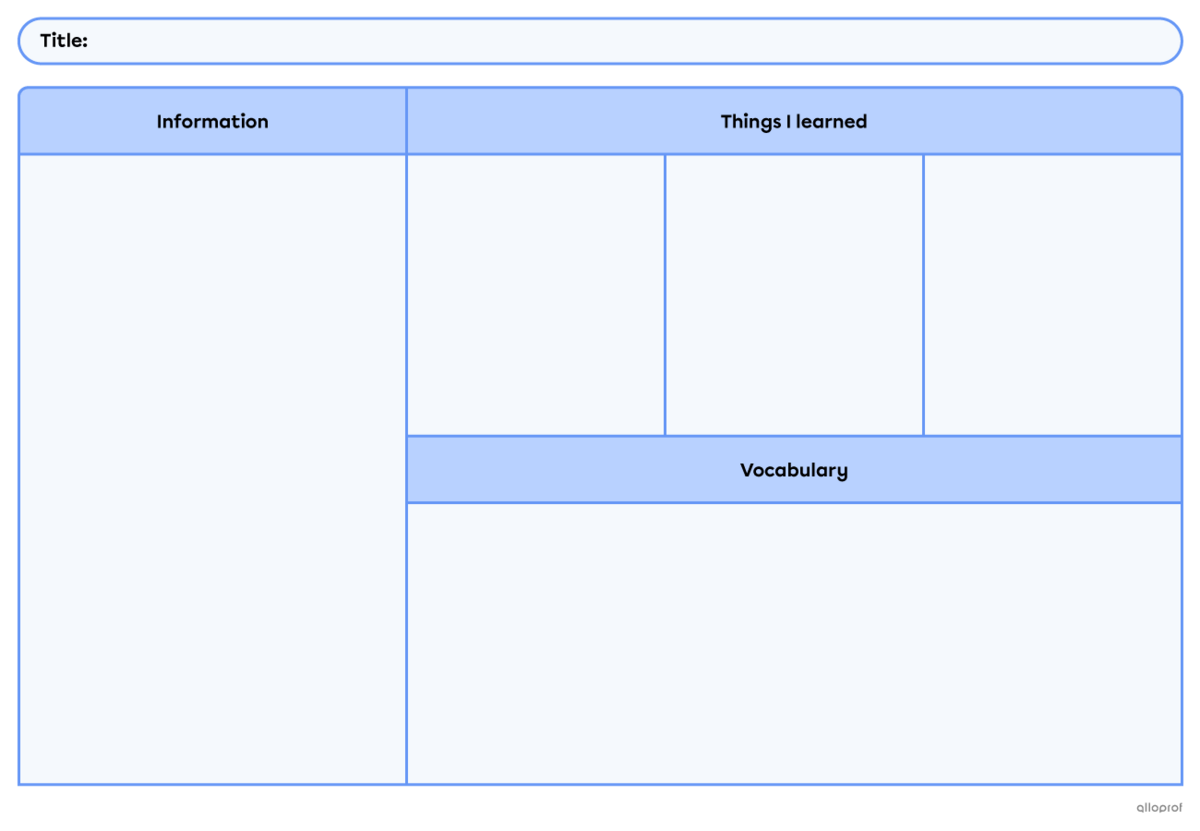
Here’s a template example to organize information when taking notes.
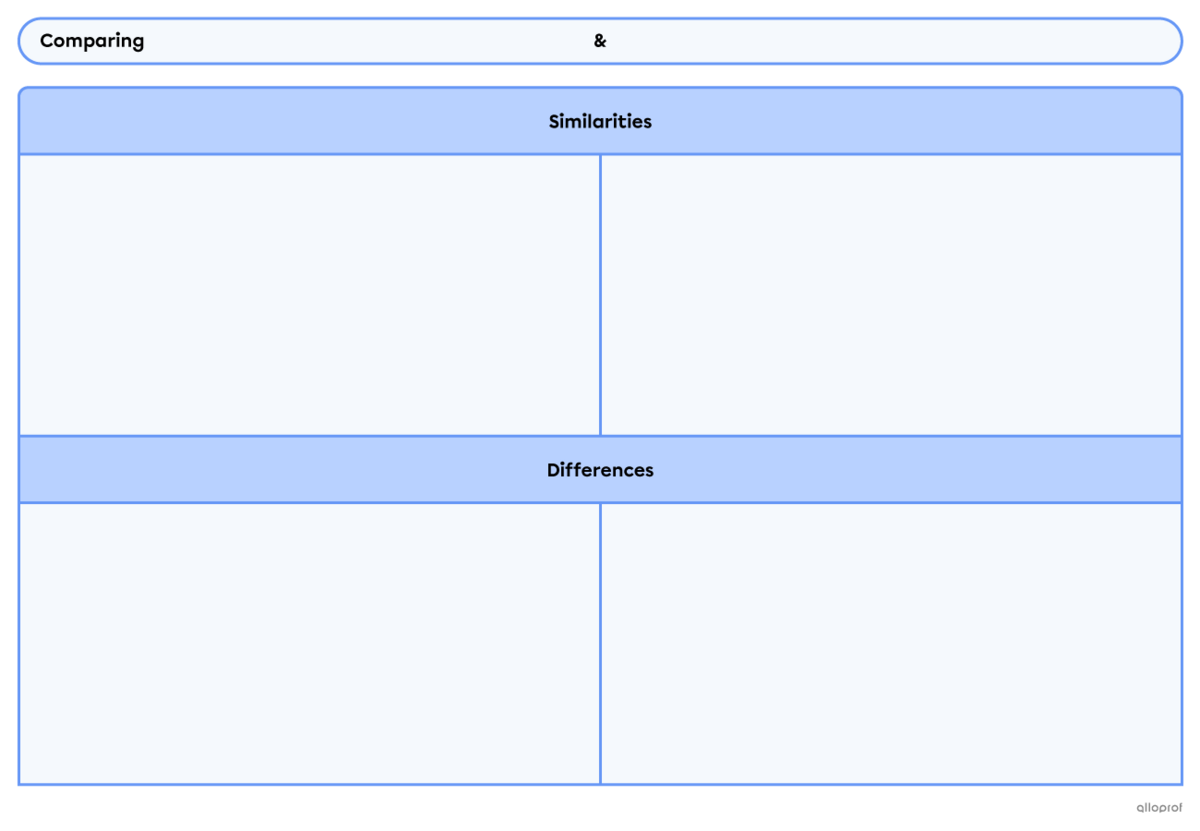
Venn diagrams are effective tools to visually compare two topics/concepts.
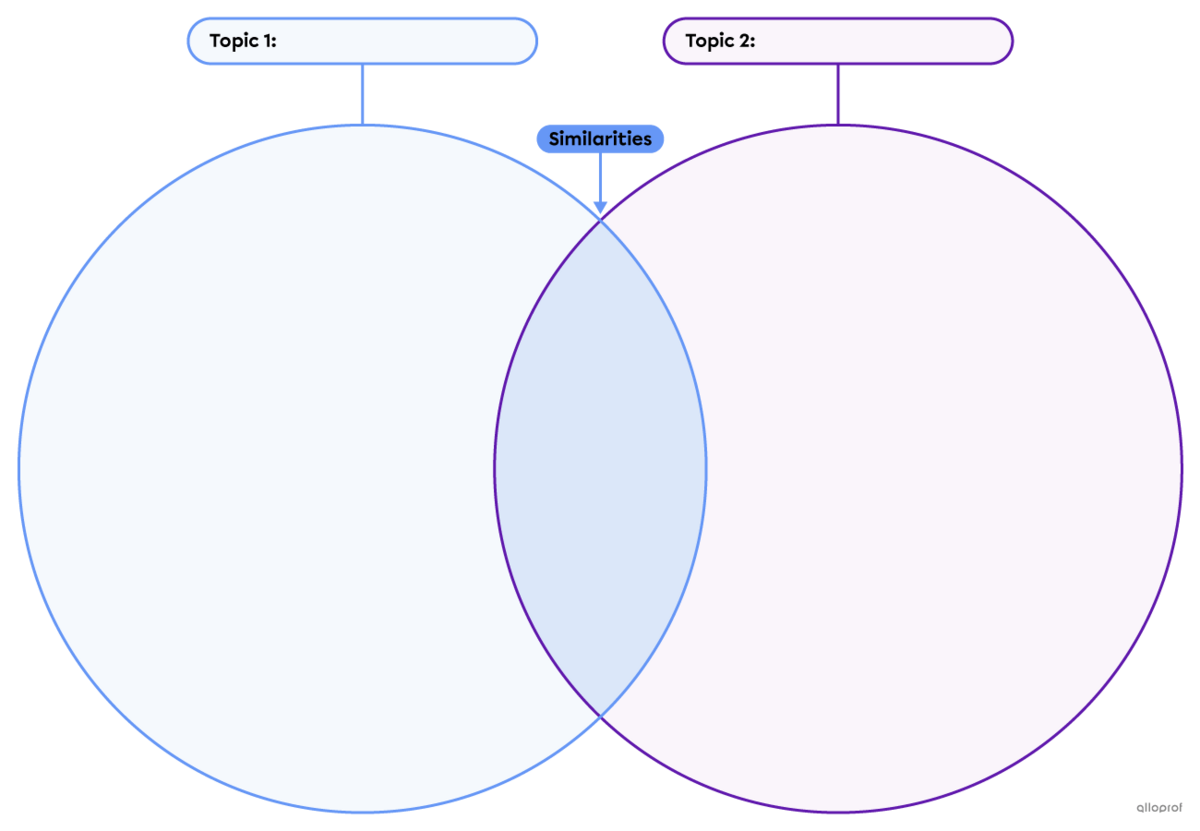
Here’s another way to compare concepts.