Subjects
Grades
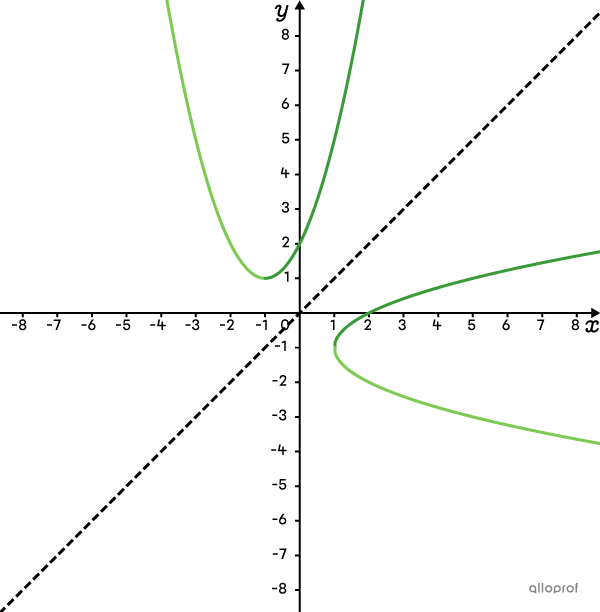
The square root function is a branch of the inverse of the second-degree polynomial (quadratic) function. In other words, sketching a square root function is like sketching a horizontal half-parabola.
The table below indicates the shape of the curve according to the role of parameters |\color{#3B87CD}{a}| and |\color{#EC0000}{b}| of the square root function.
| |\color{#EC0000}{b}<0| | |\color{#EC0000}{b}>0| | |
|---|---|---|
| |\color{#3B87CD}{a}>0| |
The function is defined above and to the left of the vertex. 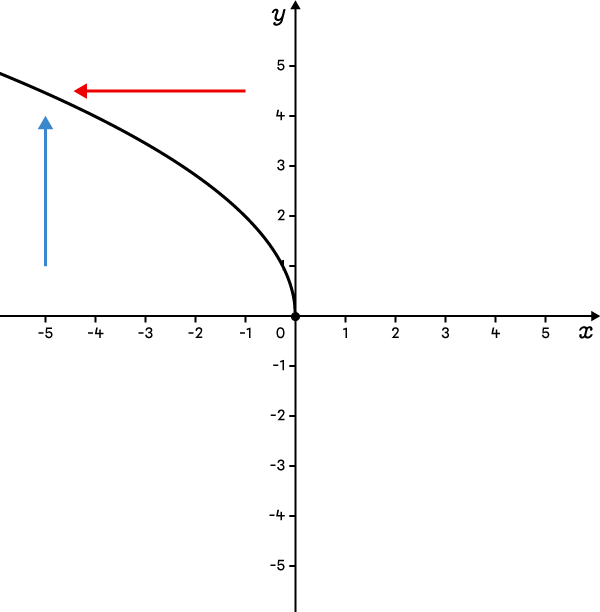 |
The function is defined above and to the right of the vertex. 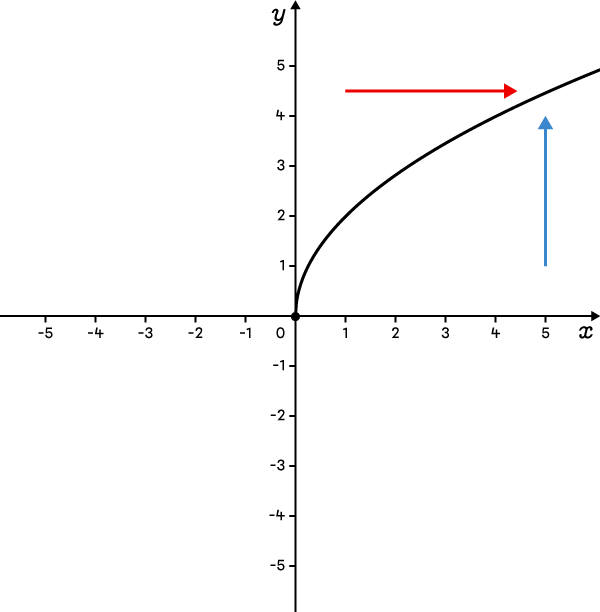 |
| |\color{#3B87CD}{a}<0| |
The function is defined below and to the left of the vertex. 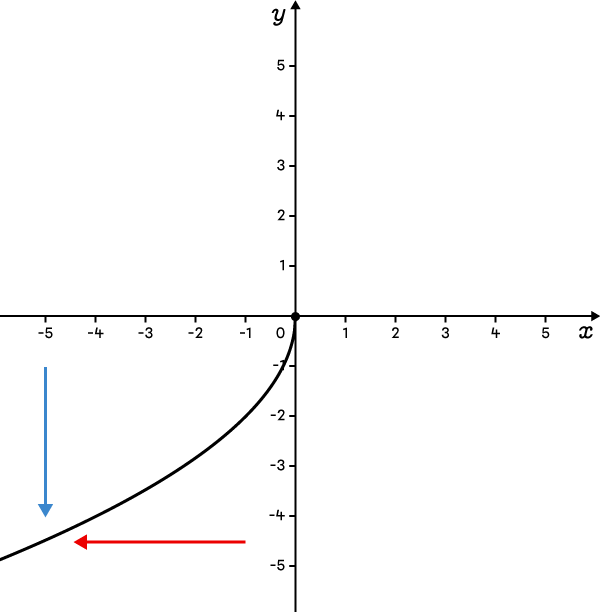 |
The function is defined below and to the right of the vertex. 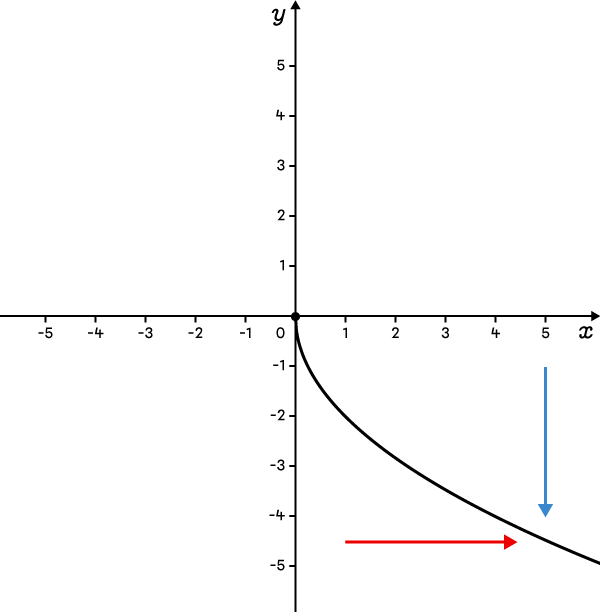 |
Use the following procedure to graph a square root function in the form of |f(x)=a\sqrt{bx}| on the Cartesian plane.
Place the vertex at the coordinates |(\color{#51B6C2}{0},\color{#FA7921}{0})| and determine the shape of the curve by analyzing parameters |\color{#3B87CD}{a}| and |\color{#EC0000}{b}.|
Calculate and plot additional points.
Graph the square root function.
Graph the function |f(x)=2\sqrt{-3x}.|
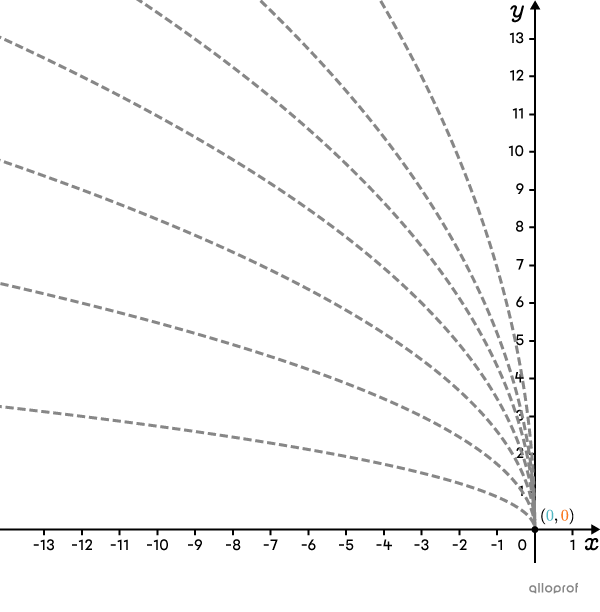
Place the vertex and determine the shape of the curve
First, place a point at the origin of the Cartesian plane. Then, analyze parameters |\color{#3B87CD}{a}| and |\color{#EC0000}{b}.|
The parameter |\color{#3B87CD}{a}| equals |\color{#3B87CD}{2},| implying the curve is above the origin.
Parameter |\color{#EC0000}{b}| equals |\color{#EC0000}{-3},| so the curve is to the left of the origin.
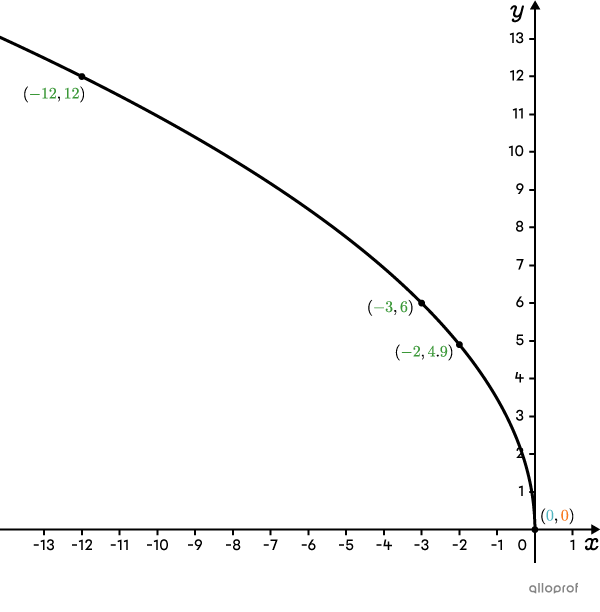
Calculate and place additional points
First choose random |\color{#3a9a38}{x}| values and calculate the corresponding |\color{#3a9a38}{f(x)}| values. Since the curve is to the left of the vertex, choose negative |\color{#3a9a38}{x}| values. First, taking |\color{#3a9a38}{x}=\color{#3a9a38}{-2}.| ||\begin{align}f(\color{#3a9a38}{x})&=2\sqrt{-3\color{#3a9a38}{x}}\\f(\color{#3a9a38}{-2})&=2\sqrt{-3(\color{#3a9a38}{-2}) }\\f(\color{#3a9a38}{-2})&=2\sqrt{6}\\\color{#3a9a38}{f(-2)}&\approx\color{#3a9a38}{4 .9}\\\end{align}||
The more points with known coordinates, the more precise the sketch of the curve. Therefore, |\color{#3a9a38}{x}=\color{#3a9a38}{-3}| and |\color{#3a9a38}{x}=\color{#3a9a38}{-12}| give the points |(-3,6)| and |(-12,12).|
Now, place the 3 points on the Cartesian plane.
Note that the 3 points are located to the left and above the origin, confirming what was determined in step 2.

Graph the function
Connecting all the points gives the curve of the function |f(x)=2\sqrt{-3x}.|
When choosing |x|-values to place additional points on the Cartesian plane, ensure the result under the root is a square number. It avoids approximating coordinates.
In the previous example, |x=-2| is not the best choice, because |-3\times-2=6.| Indeed, |6| is not a square number, because |\sqrt{6}\approx245.| However, |x=-3| and |x=-12| result in |9| and |36| respectively, two square numbers under the root.
Use the following procedure to sketch a square root function in the form of |f(x)=a\sqrt{b(x-h)}+k| on the Cartesian plane.
Place the vertex at the coordinates |(\color{#51B6C2}{h},\color{#FA7921}{k})| and analyze parameters |\color{#3B87CD}{a}| and |\color{#EC0000}{b}| to determine the shape of the curve.
Calculate and plot additional points.
Graph the square root function.
In step 3, although it is not always possible, calculate the value of the zero (the |x|-intercept) and the |y|-intercept.
Graph the function |f(x)=-3\sqrt{x-2}+6.|
Place the vertex at coordinates |(h,k)| and analyze the parameters |a| and |b| to determine the curve’s shape
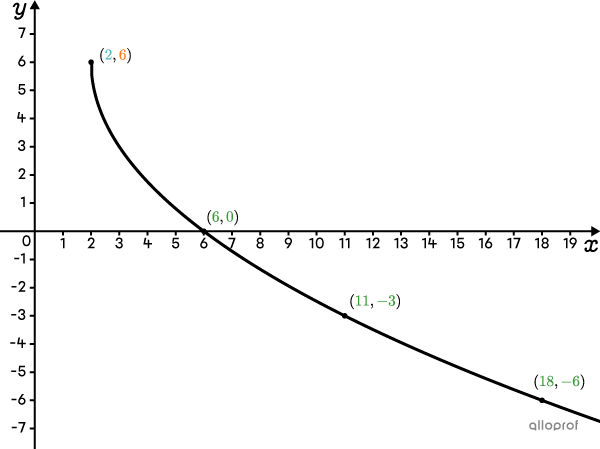
The function, |\color{#51b6c2}{h}=\color{#51b6c2}{2}| and |\color{#fa7921}{k}=\color{#fa7921}{6}.| So, place the vertex at |(\color{#51b6c2}{2},\color{#fa7921}{6}).|
Parameter |\color{#3B87CD}{a}| equals |\color{#3B87CD}{-3},| meaning the curve is below the vertex.
Parameter |\color{#EC0000}{b}| equals |\color{#EC0000}{1},| so the curve is to the right of the vertex.
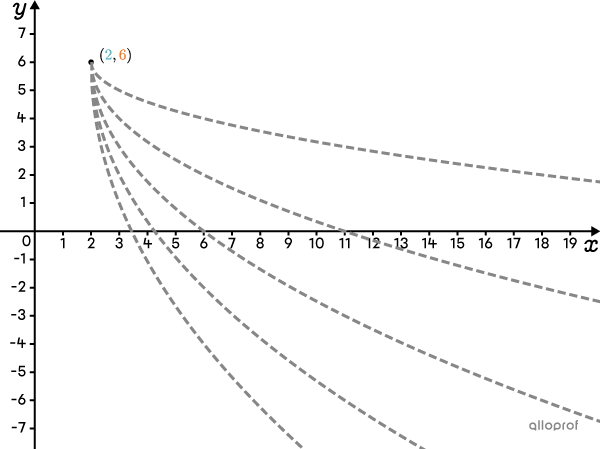
Calculate and place additional points
It can be determine from the previous image that all the potential curves cross the |x|-axis. It implies the function has an |x|-intercept. However, there is no |y|-intercept because none of the curves cross the |y|-axis. Now, replace |f(x)| with |0| to calculate the |x|-intercept. ||\begin{align}\color{#3a9a38}{f(x)}&=-3\sqrt{x-2}+6\\\color{#3a9a38 }{0}&=-3\sqrt{x-2}+6\\-6&=-3\sqrt{x-2}\\2&=\sqrt{x-2}\\4&=x-2\\6&=x\\\end{align}||
Therefore, the curve has a zero at |(6,0).| The function |f(x)=-3\sqrt{x-2}+6| does not have a |y|-intercept. Replacing |x| with |0| gives |\sqrt{-2},| which is not possible.
Now, calculate the coordinates of a few additional points to sketch a more precise function. Since the curve is to the right of the vertex, choose |x|-values greater than |2.| First, we can use |x=11.|
||\begin{align}f(\color{#3a9a38}{x})&=-3\sqrt{\color{#3a9a38}{x}-2}+ 6\\f(\color{#3a9a38}{11})&=-3\sqrt{\color{#3a9a38}{11}-2}+6\\f(11)&=-3\sqrt{9 }+6\\f(11)&=-3\times3+6\\\color{#3a9a38}{f(11)}&=\color{#3a9a38}{-3}\\\end{align}|| Similarly, with |x=18,| it gives another point with the coordinates |(18,-6).|
Place the |x|-intercept and the 2 points on the Cartesian plane.
Note that the 3 points are located to the right and below the vertex, confirming what was determined in step 2.

Graph the function
Connecting all the points, we obtain the graph of the function |f(x)=-3\sqrt{x-2}+6.|