Subjects
Grades
A pictograph presents the results of a survey using images, symbols or icons.
A pictograph can be presented in two ways: horizontally or vertically.
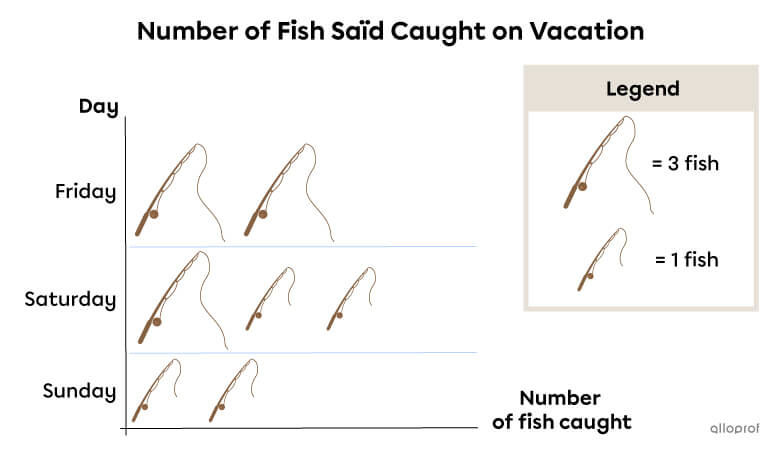
Horizontal pictograph:
Vertical pictograph:
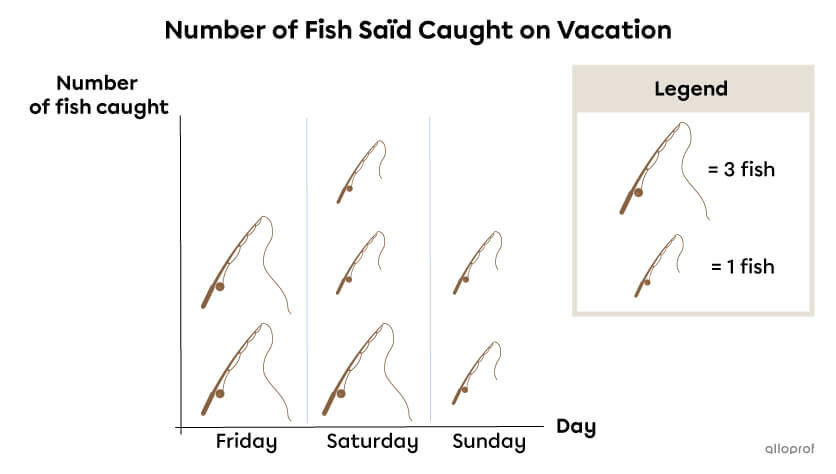
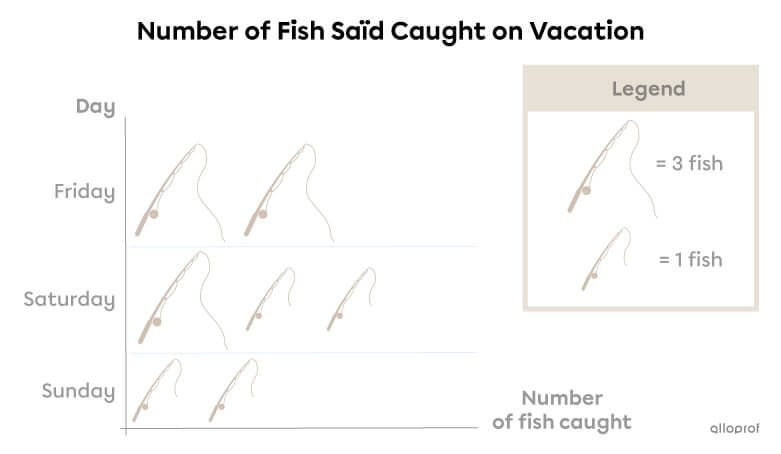
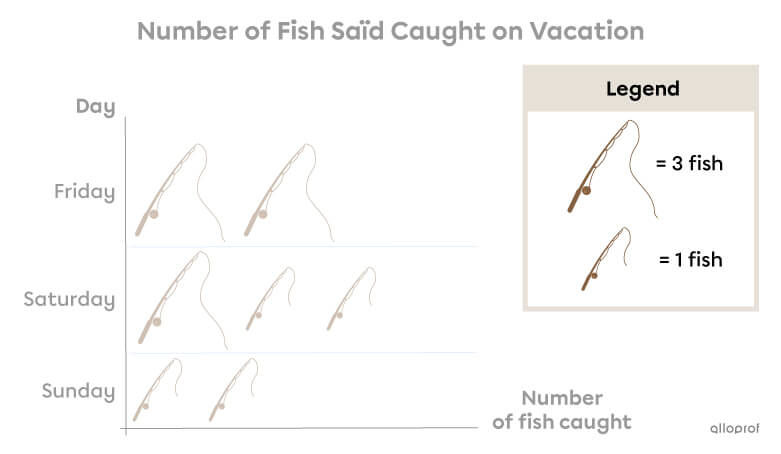
The title of a pictograph always presents the subject of a survey.
The title indicates that this pictograph represents the number of fish caught by Saïd during his vacation.
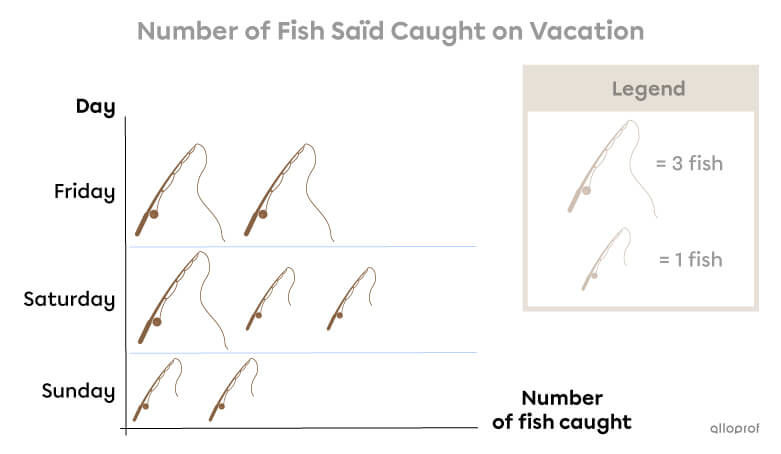
A pictograph has 2 axes: the vertical axis and the horizontal axis. Each axis has a label indicating what it represents.
In this graph, the vertical axis represents the days. The horizontal axis represents the number of fish caught.
The categories present the information collected in the pictograph.
The graph shows the number of fish caught on Friday, Saturday and Sunday.
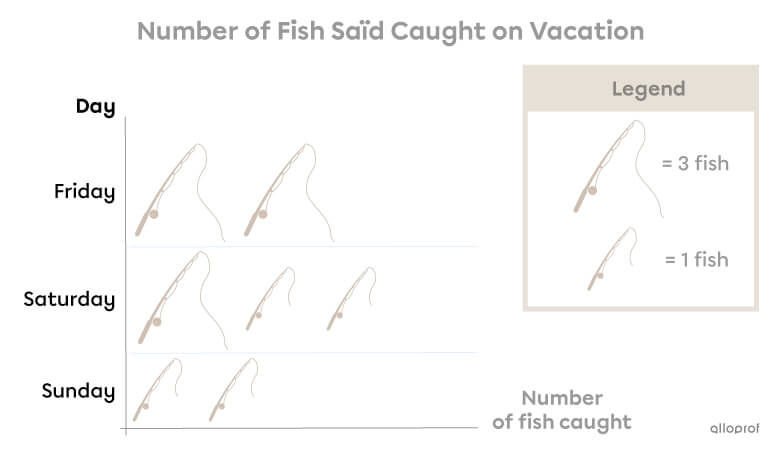
In a pictograph, the data (results) are represented by images, symbols or icons. The legend specifies the value of each image.
The legend shows that the big fishing rod represents 3 fish and the small fishing rod represents 1 fish.
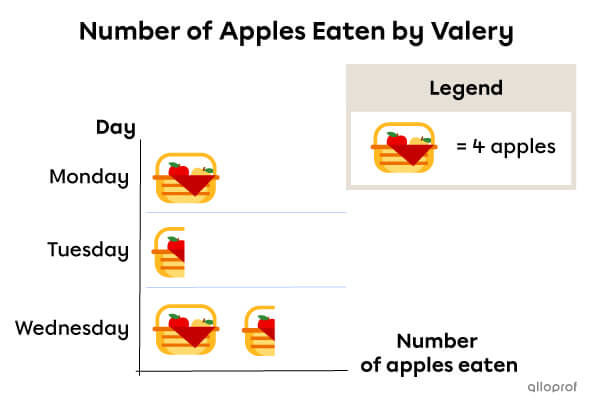
In some pictographs, half-symbols are used. Find the value of the whole symbol first, and then divide it by 2.
The legend indicates that a whole basket is equal to 4 apples. To find the value of a half-basket, divide 4 by 2.
4 ÷ 2 = 2
One half-basket equals 2 apples.
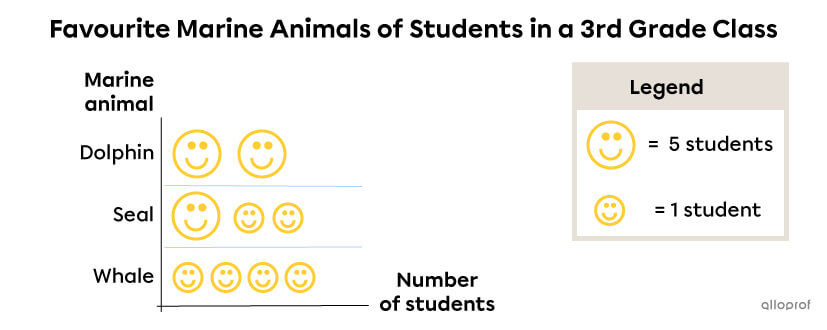
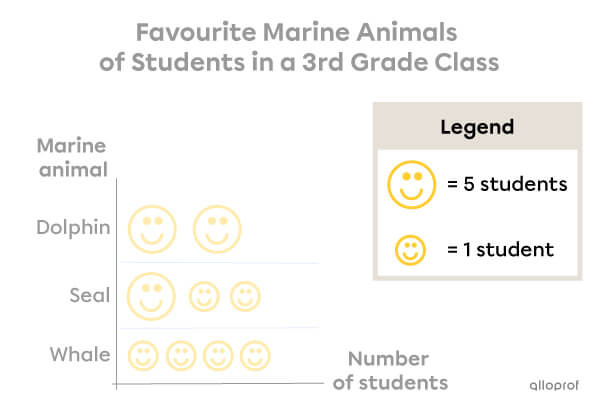
To interpret a pictograph, you must analyze all the parts of the graph while keeping the question that was asked in mind.
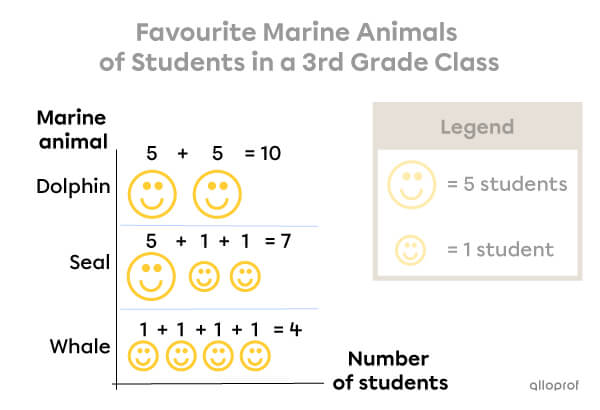
What is the least popular marine animal in this 3rd grade class?
|  |
|  |
| 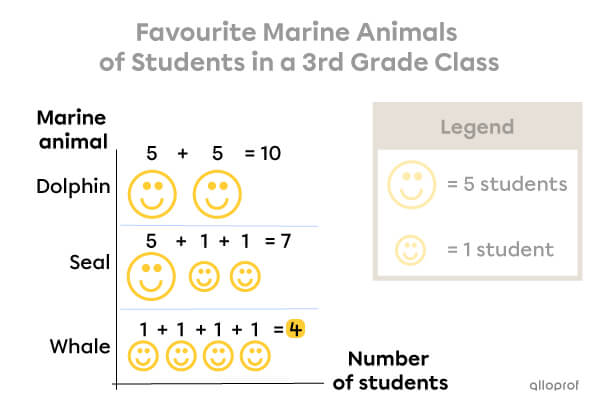 |
In this 3rd grade class, the least popular marine animal is the whale.
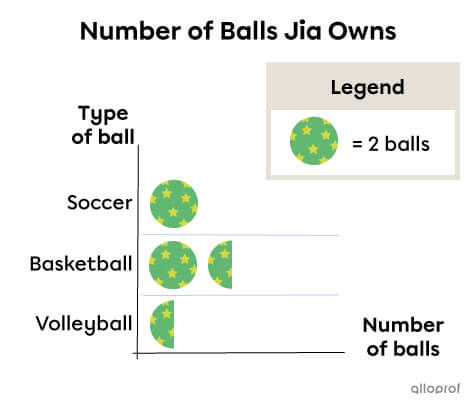
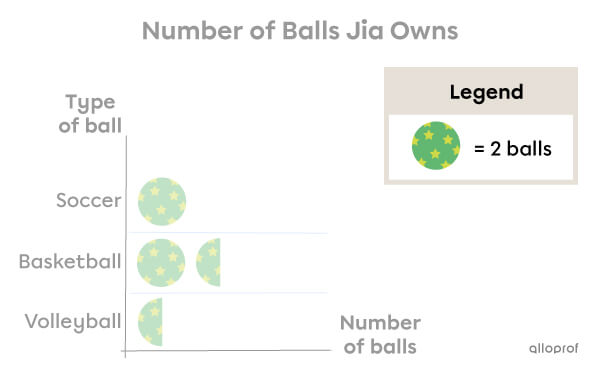
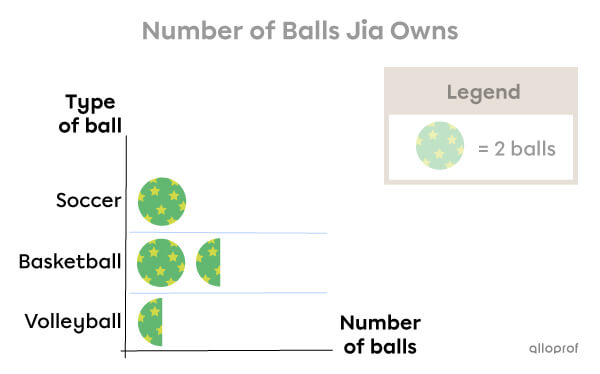
How many balls does Jia have altogether?
|  |
|  |
| 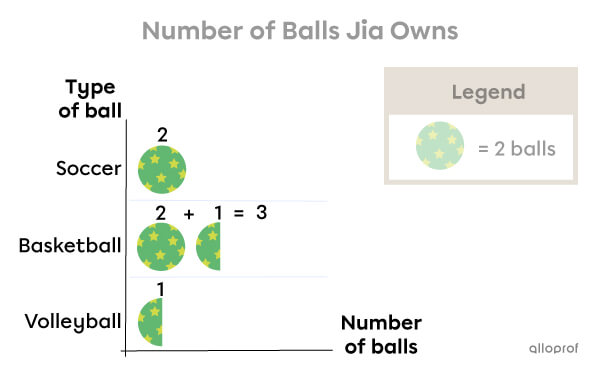 |
Jia has 6 balls in total.