Subjects
Grades
A pictograph presents the results of a survey using images, symbols or icons.
A pictograph can be presented in two ways: horizontally or vertically.
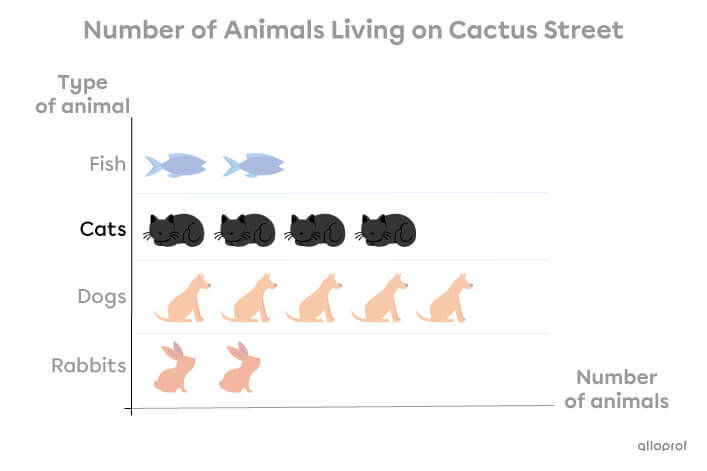
Horizontal pictograph:
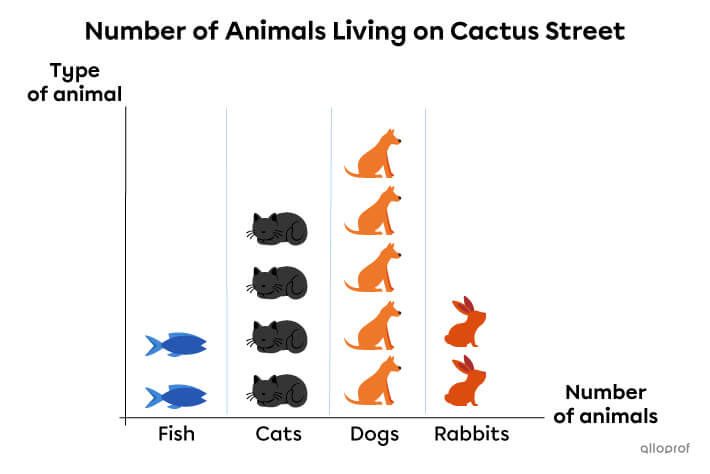
Vertical pictograph:
The title of a pictograph always presents the subject of a survey.
The title indicates that this pictograph presents the number of animals that live on Cactus Street.
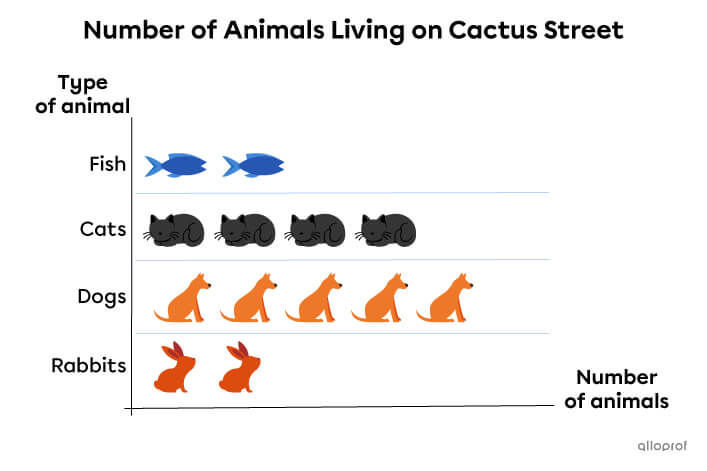
The categories specify what information is contained in the pictograph.
This pictograph shows the number of fish, cats, dogs and rabbits that live on Cactus Street.
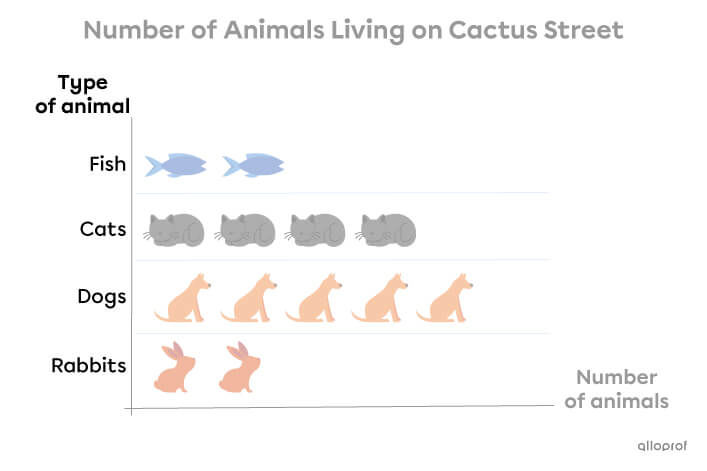
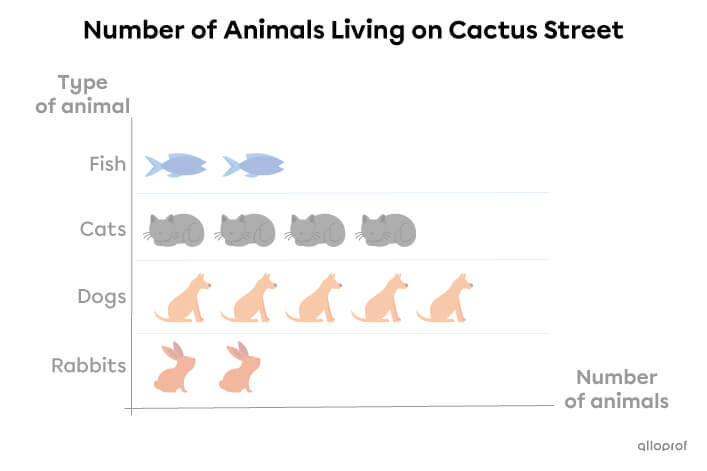
In a pictograph, the data (results) are represented by images, symbols or icons. Each image represents a piece of data.
There are 4 images in the cat category. This indicates that there are 4 cats living on Cactus Street.