Subjects
Grades
In mathematics, the concept of proportion leads to two types of situations with interesting properties.
With the exception of the point |(0,0),| a situation is directly proportional when the comparison of the two variables' associated values reveal equivalent ratios or rates.
Normally, in these situations, if the value of one variable increases, the value of the other variable will also increase at a constant rate.
These situations are also called proportional situations.
In a directly proportional situation, if one of the variables is equal to zero, then so is the other.
Directly proportional situations are represented by a first degree linear function (direct linear variation).
A directly proportional situation can be represented by a statement, a table of values, a graph, or a rule.
A directly proportional situation can be represented by a statement.
Generally, in directly proportional situations, increasing the value of one variable will cause the other variable’s value to increase at a constant rate.
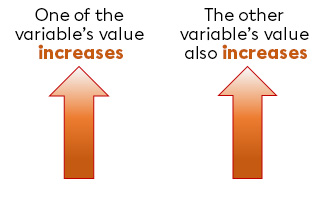
In other words, the variables vary in the same direction.
Without solving the problem, determine what type of situation this is.

Sarah is a lifeguard at a beach not far from her home. She is paid |$13| per hour. Sarah wonders how much she will earn after |40| hours of work.
Note that, in this situation, the variables are the number of hours worked by Sarah and the salary she earned. Without solving the problem, it is possible to determine that the more hours Sarah works, the more she earns! Also, if she doesn’t work, she gets no money.
As the increase of one variable (the hours worked) leads to the increase of the other variable (the salary) at a constant rate from |(0,0),| we can conclude that this is a directly proportional situation.
In a table of values, we can recognize a directly proportional situation in two ways.
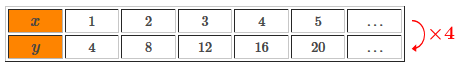
In a directly proportional situation, the factor of change is the number by which to multiply the first variable’s values to obtain the second variable’s associated values.
In a directly proportional situation, all the second variable’s values are obtained by multiplying the first variable’s associated value by the factor of change.
Consider the following table of values.
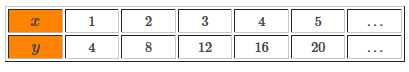
Note that we must always multiply the variable’s values |x| by |\color{#EC0000}{4}| to obtain the associated values of the variable |y.|
||\begin{align}1\times\color{#EC0000}{4}&=4\\2\times\color{#EC0000}{4}&=8\\3\times\color{#EC0000}{4}&=12\\&...\end{align}|| Therefore, the factor of change is |\color{#EC0000}{4}.|
Therefore, the situation represented by the table of values is directly proportional.
In a directly proportional situation, the proportionality ratio corresponds to the ratio between the values of the variable |x| and the variable |y| .
For |y\neq0| , the ratios will look like the following. ||\dfrac{x}{y}||
In a directly proportional situation, the proportionality ratio is constant.
Go back to the table of values from the example above.
The following ratios are obtained.
||\dfrac{x}{y}=\dfrac{1}{4}=\dfrac{2}{8}=\dfrac{3}{12}=\ ...|| Note that all the ratios are equivalent to |\dfrac{1}{4}.|
Thus, the proportionality ratio of the situation is |\color{#EC0000}{\dfrac{1}{4}}.|
As the proportionality ratio is constant, then the situation represented by the table of values is directly proportional.
It is possible to recognize a directly proportional situation using a graph.
A graph representing a directly proportional situation includes either a straight line passing through the origin of the Cartesian plane, or points belonging to a straight line passing through the origin of the Cartesian plane.
The following two graphs represent directly proportional situations.

A directly proportional situation can be recognized using a rule.
The rule of a directly proportional situation is |y=(\text{Factor of Change})\times(x).|
In the situation represented by the following table of values, the factor of change is |\color{#EC0000}{4}.|
Therefore, the rule representing the situation is: ||y=\color{#EC0000}4x||
A situation is called inversely proportional, or an inverse variation function, when the product of the two variable’s associated values is constant.
An inversely proportional situation can be represented by a statement, a table of values, a graph, or a rule.
An inversely proportional situation can be represented by a statement.
Generally, in inversely proportional situations, increasing the value of one of the variables causes a proportional decrease in the value of the other variable.
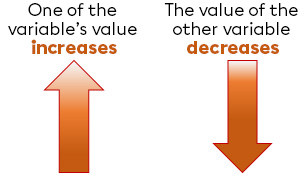
Thus, if the value of the independent variable becomes twice as large, the dependent variable will become twice as small.
Without solving the problem, determine what type of situation this is.

Adam is a paperboy for the local newspaper. Every Saturday morning he must distribute |66| newspapers in his neighborhood. One Saturday, he asks his friends to help him. Adam wonders how many newspapers each of them will have to deliver if he succeeds in convincing |5| of his friends.
In this situation, note that the variables are the number of friends involved and the number of newspapers delivered by each. Without solving the problem, it is possible to determine that the more friends Adam has helping him, the fewer newspapers each of them will have to deliver.
As the increase of one of the variables (the number of friends involved) leads to the decrease of the other variable (the number of newspapers delivered by each one), this illustrates an inversely proportional situation.
In a table of values, a situation is inversely proportional when the same result (product) is always obtained when multiplying the first variable’s values by the corresponding value of the associated second variable.
Consider the following table of values.
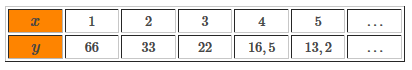
Note that for each point |(x,y),| multiplying the value of the variable |x| by the variable |y| always results in the same product.
||\begin{align}1\times66&=\color{#EC0000}{66}\\2\times33&=\color{#EC0000}{66}\\3\times22&=\color{#EC0000}{66}\\&\dots\end{align}|| Thus, the situation is inversely proportional.
An inversely proportional situation can be recognized using a graph.
A graph representing a situation that is inversely proportional shows a curve that tends to approach the axis without touching it or points belonging to a curve that tends to approach the axis without touching it.
The following graphs represent inversely proportional situations.

In the case of these basic inversely proportional functions, they do not pass through the origin of the Cartesian plane.
An inversely proportional situation can be recognized using a rule.
The rule of an inversely proportional situation is |y=\dfrac{\text{Constant product}}{x}| where |\text{Constant product}\neq0| and |x\neq0.|
As demonstrated above, in the inversely proportional situation represented by the table of values below, the constant product is |\color{#EC0000}{66}.|
Therefore, the rule representing the situation is |y=\dfrac{\color{#EC0000}{66}}{x}.|