Subjects
Grades
Here are the different methods used to sketch an exponential function.
Graph the exponential function using its rule and a table of values by following these steps.
With the rule of the exponential function, replace |x| by a minimum of four values which can be randomly chosen according to the situation.
Find the equation of the horizontal asymptote.
Place the points obtained |(x,y)| and sketch the asymptote on a Cartesian plane, then connect the points to draw the curve.
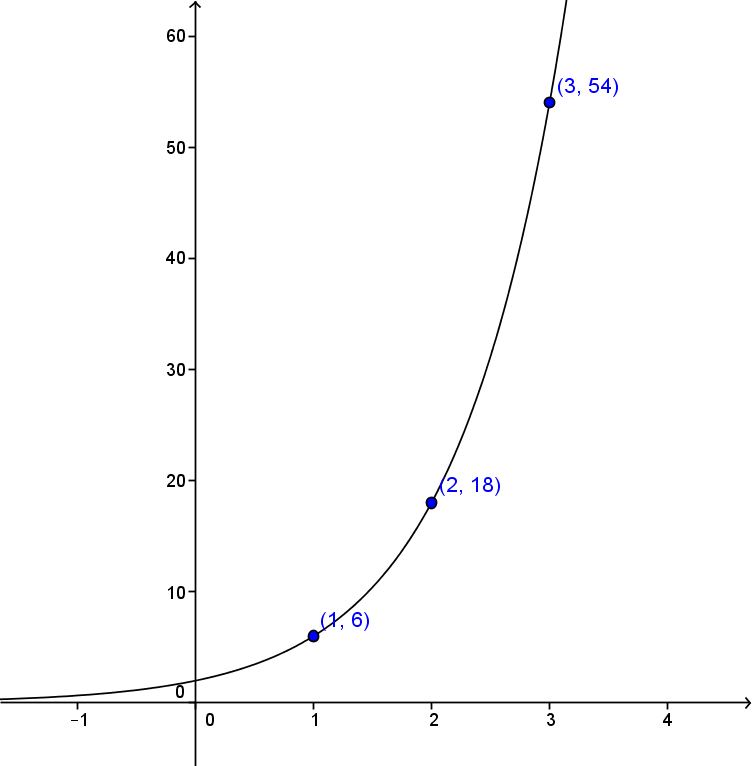
Sketch the following exponential function.
||y=2(3)^x||
With the rule of the exponential function, replace |x| by a minimum of four values randomly chosen according to the situation
We can replace |x| by the values |0,| |1,| |2,| and |3.|
||\begin{align}
\text{For} \ \ x_1 &= 0, \\
y_1&=2(3)^{0}\\
&= 2 \\\\
\text{For} \ \ x_2 &= 1, \\
y_2 &= 2(3)^{1}\\
&= 6\\\\
\text{For} \ \ x_3 &= 2, \\
y_3 &= 2(3)^{2} \\
&= 18 \\\\
\text{For} \ \ x_4 &= 3, \\
y_4 &= 2(3)^{3}\\
&= 54\end{align}||
Therefore, the following table of values is obtained.
|
|x| |
|0| |
|1| |
|2| |
|3| |
|---|---|---|---|---|
|
|y| |
|2| |
|6| |
|18| |
|54| |
Find the equation of the horizontal asymptote
In this case, the horizontal asymptote is on the |x|-axis because |k=0.|
Plot the points obtained |(x,y)| and the horizontal asymptote on a Cartesian plane. Connect the points to draw the curve
Placer les points obtenus |(x,y)| et l'asymptote dans un plan cartésien et relier les points pour tracer la courbe.
If the exponential function equation is of the form |y=a(c)^{x},| we can immediately find and plot the point |(0,a),| because |a| corresponds to the initial value.
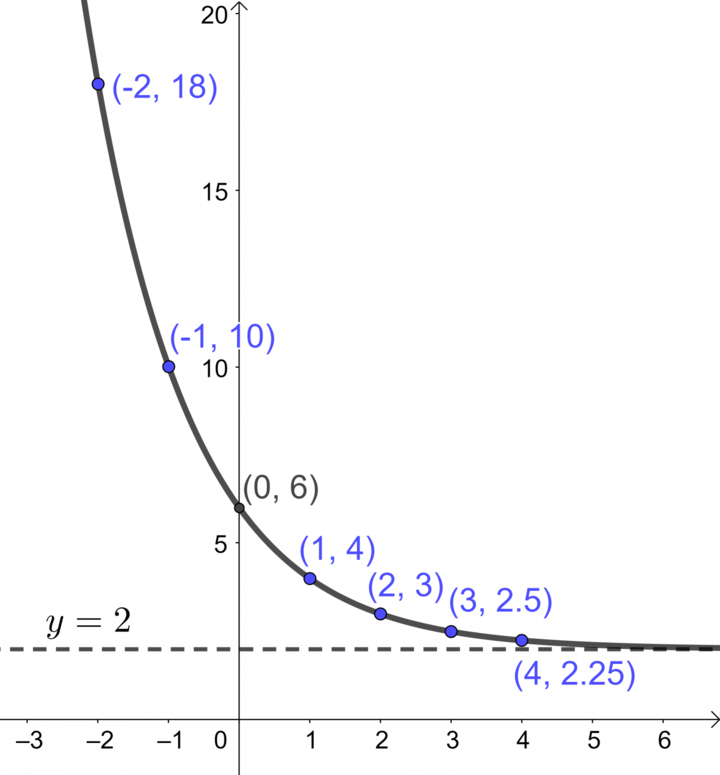
Graph the following exponential function.
||y=4(0.5)^x+2||
With the rule of the exponential function, replace |x| with a minimum of four randomly chosen values according to the situation
For the sake of precision, more than four coordinates of the points of the function can be calculated.
||\begin{align}
\text{For} \ \ x_1 &= -2, \\
y_1&=4(0.5)^{-2}+2\\
&= 18 \\\\
\text{For} \ \ x_2 &= -1, \\
y_2 &= 4(0.5)^{-1}+2\\
&= 10\\\\
\text{For} \ \ x_3 &= 0, \\
y_3 &= 4(0.5)^{0}+2 \\
&= 6 \\\\
\text{For} \ \ x_4 &= 1, \\
y_4 &= 4(0.5)^{1}+2 \\
&= 4\\\\
\text{For} \ \ x_5 &= 2, \\
y_5 &= 4(0.5)^{2}+2 \\
&= 3\\\\
\text{For} \ \ x_6 &= 3, \\
y_6 &= 4(0.5)^{3}+2 \\
&= 2{.}5\\\\
\text{For} \ \ x_7 &= 4, \\
y_7 &= 4(0.5)^{4}+2 \\
&= 2.25 \end{align}||
Next, make a table of values.
|
|x| |
|-2| |
|-1| |
|0| |
|1| |
|2| |
|3| |
|4| |
|---|---|---|---|---|---|---|---|
|
|y| |
|18| |
|10| |
|6| |
|4| |
|3| |
|2.5| |
|2.25| |
Find the equation of the horizontal asymptote
In this case, the equation of the asymptote is defined by:
||\begin{align}
y&= k \\
y&= 2\end{align}||
Plot the previously calculated points |(x,y)| and the horizontal asymptote on a Cartesian plane. Connect the points to sketch the curve
If the equation of the exponential function is of the form |y=a(c)^{x}+k,| the equation of the horizontal asymptote |y=k| can be determined. In addition, the point |(0,\ a+k)| can be plotted. In this form, if |x| is replaced with |0,| it leaves |a+k,| which corresponds to the initial value of the function.
It is not always necessary to be so precise. The asymptote, |y|-intercept, and two other points are often enough to create a good sketch of the function.
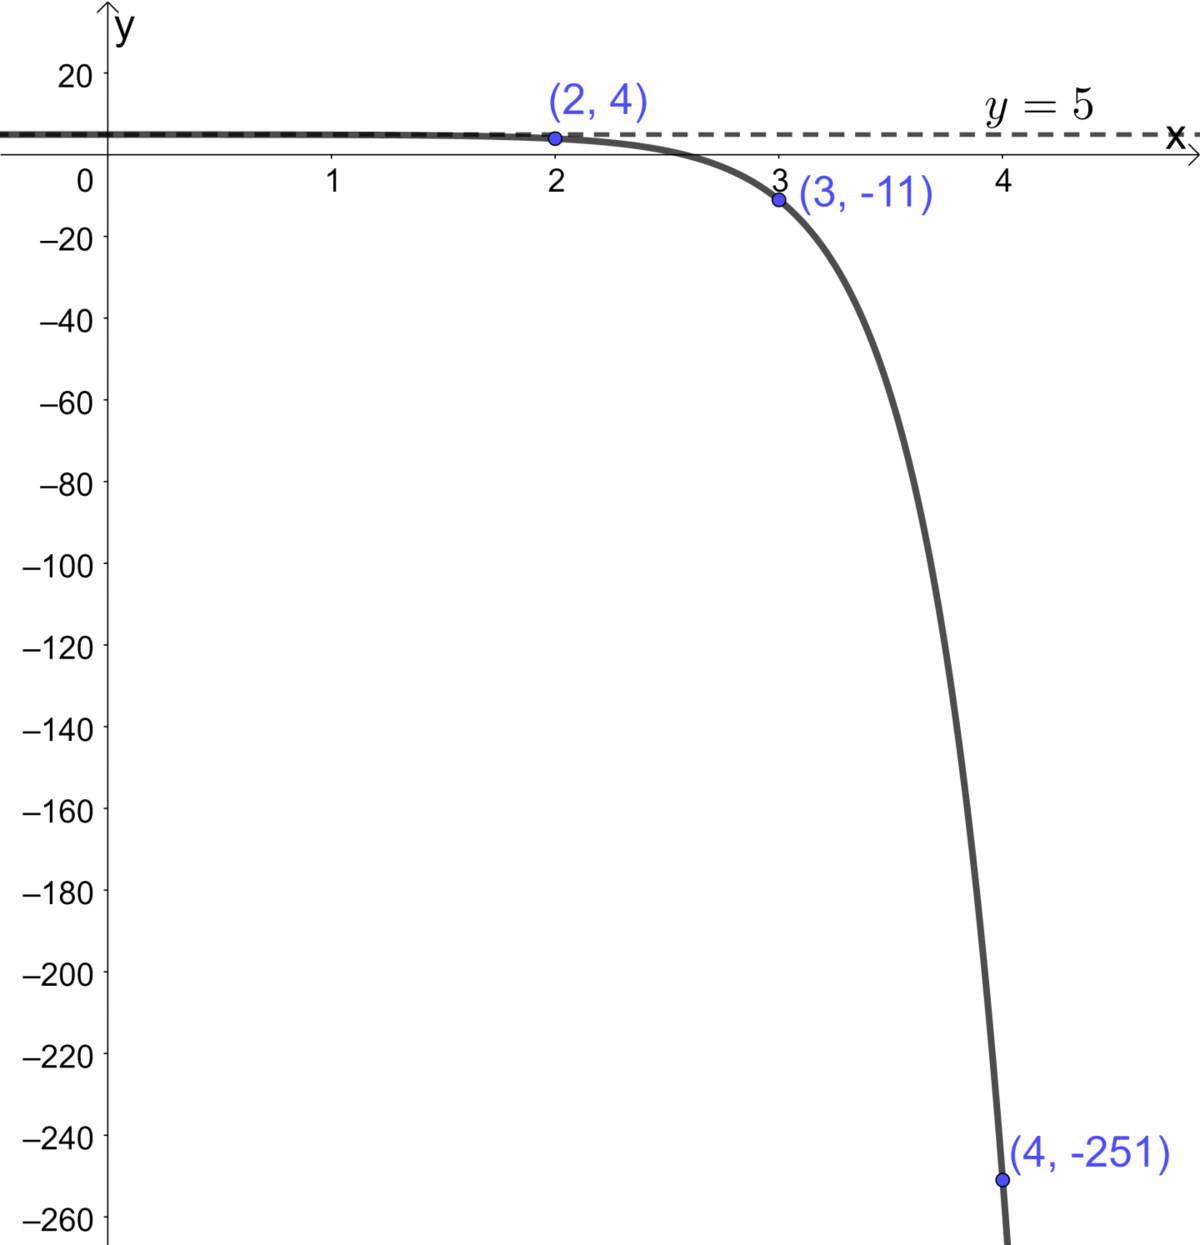
Graph the following exponential function.
||y = -1(2)^{4(x-2)}+5||
With the rule of the exponential function, replace |x| with a minimum of four values randomly chosen according to the situation
We can replace |x| with the values |2,\ 3,\ 4| and |5.|
||\begin{align}
\text{For} \ \ x_1 &= 2, \\
y_1&=-1(2)^{4(2-2)}+5\\
&= 4 \\\\
\text{For} \ \ x_2 &= 3, \\
y_2 &= -1(2)^{4(3 - 2)} + 5\\
&= -11\\\\
\text{For} \ \ x_3 &= 4,\\
y_3 &= -1(2)^{4(4 - 2)} + 5\\
&= -251 \\\\
\text{For} \ \ x_4 &= 5,\\
y_4 &= -1(2)^{4(5 - 2)} + 5\\
&= -4\ 091\end{align}||
The following table of values is obtained.
|
|x| |
|2| |
|3| |
|4| |
|5| |
|---|---|---|---|---|
|
|y| |
|4| |
|-11| |
|-251| |
|-4\ 091| |
Find the equation of the horizontal asymptote
Here, the equation of the asymptote is defined by:
||\begin{align}
y&= k \\
y&= 5\end{align}||
Plot the previously calculated points |(x,y)| and sketch the asymptote on a Cartesian plane. Connect the points to sketch the curve
Graph an exponential function using its parameters by following these steps.
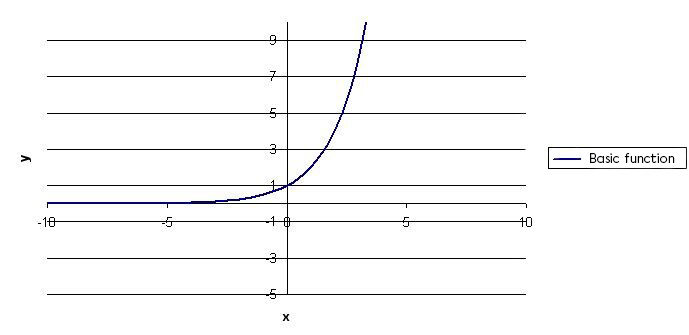
Sketch the basic exponential function |y=(c)^x.|
If necessary, modify the vertical scale change created by parameter |a| and the reflection.
If necessary, modify the horizontal scale change created by parameter |b| (factor |\dfrac{1}{{\mid}b{\mid}}|) and the reflection.
Perform the vertical translation indicated by the parameter |k.|
Perform the horizontal translation indicated by the parameter |h.|
Note: These last four operations can be performed in any order.
Graph the following exponential function.
||y=2(2)^{-3(x+4)}-3||
Sketch the basic exponential function |y=(c)^x|
In this example,
||\begin{align}
y&=(c)^x \\
y&= (2)^x \end{align}||
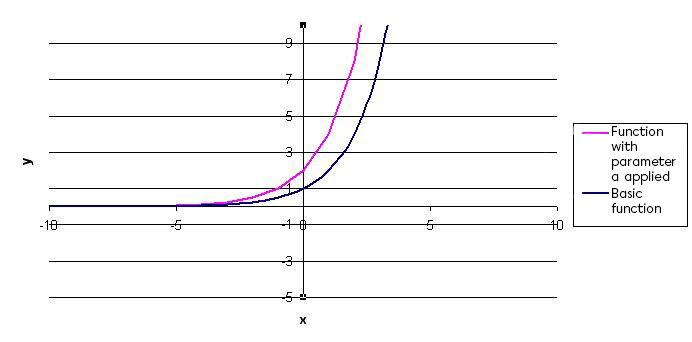
If necessary, modify the vertical scale change created by parameter |a| and the reflection
Since parameter |a| is equal to |2,| the curve must be "stretched" vertically by a factor of |2.| This indicates that it is necessary to multiply all of the |y|-values of the basic function by |2.|
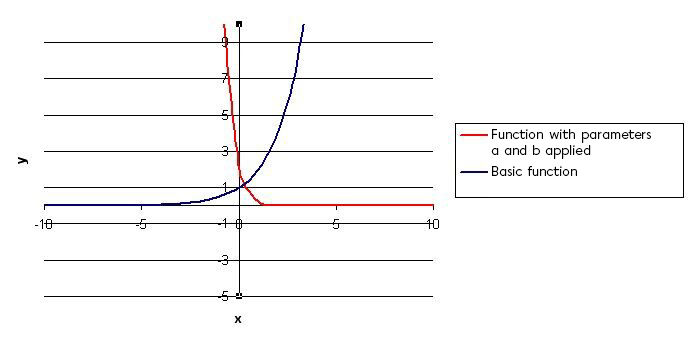
If necessary, modify the horizontal scale change created by the parameter |b| (factor |\frac{1}{\mid b \mid}|) and reflection
Since parameter |b| is equal to |-3,| the curve must be reflected with respect to the |y|-axis. The curve must also be “contracted” horizontally by a factor of |\frac{1}{3}.| All of the |x|-values of the basic function must be divided by |-3.|
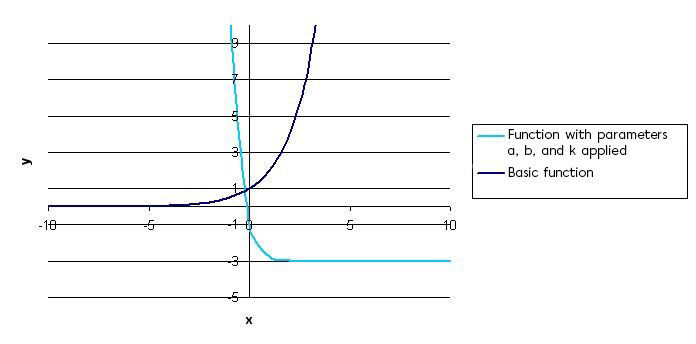
Perform the vertical translation indicated by the parameter |k|
Since parameter |k| is equal to |-3,| a vertical translation of |3| units downwards is required.
Perform the horizontal translation indicated by the parameter |h|
Since parameter |h| is equal to |-4,| |\big(x-(-4)\big),| a horizontal translation of |4| units to the left is required.
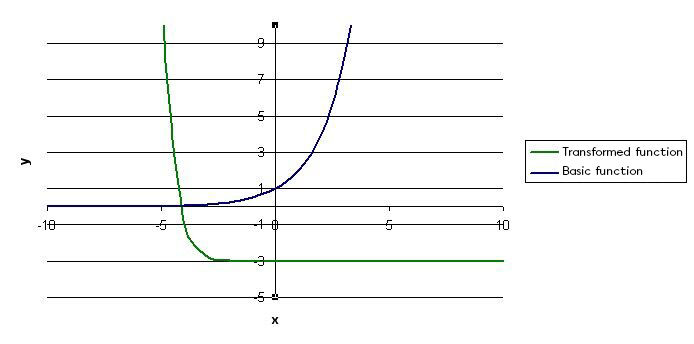
Therefore, the desired curve is obtained.
The characteristics of the curve obtained can be verified:
a horizontal asymptote at |y = -3| is obtained which corresponds to |y = k;|
a decreasing curve is obtained whereby the values of |y| are greater than |k,| as is the case when parameter |a| is positive and parameter |b| is negative.
To ensure that the graph sketched is correct, here are some important things to verify:
The position of the asymptote (given by the parameter |k|);
The reflections in relation to the two axes (given by the signs of the parameters |a| and |b|);
The direction of the function (if it’s increasing or decreasing).