Subjects
Grades
A system of equations can be represented by a graph or by tables of values. These representations can also enable us to solve the system.
When a system of equations is represented by a graph, it suffices to look for the intersection point of the lines to determine the solution point |(x, y).|
Consider the following graph.
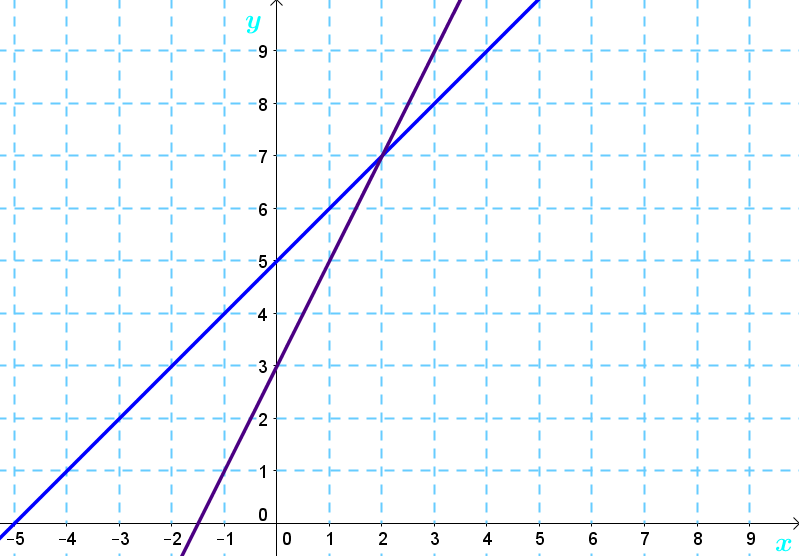
We can see that the lines meet at the point |(2, 7),| which is the solution point of the system of equations.
Note: In the case of a system of semi-linear equations, it is possible to have two solutions for the same system of equations.
Consider the following graph.
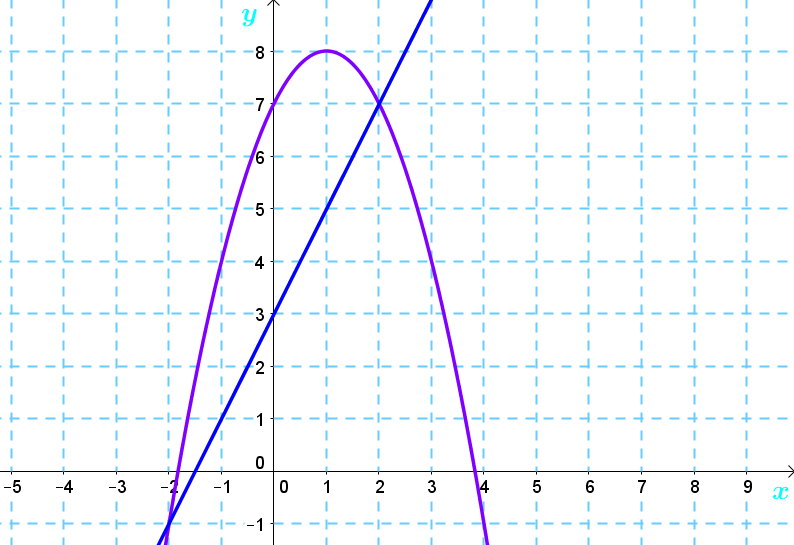
The parabola and the line intersect at two points, so there are two solution points, i.e., the points |(-2,-1)| and |(2,7).|
When the tables of values for a system of equations are provided, the tables of values of each line can be compared to determine the solution point |(x, y).| Therefore, it is necessary to find an independent variable value for which both of the dependent variable values are identical.
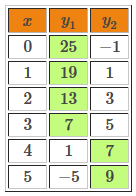
See the following two tables of values.
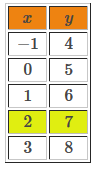
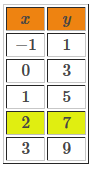
For the same value of |x| |(x=2),| we can find an identical value of |y| (|y=7|) in both tables of values. Therefore, the solution point of the system of equations is |(2,7).|
The tables of values for the system of equations will not always be provided. When this happens, it is necessary to construct the tables of values using the equations found in the system.
In the following system of equations, |y_1| corresponds to the dependent variable of the first equation and |y_2| to that of the second equation.
||\begin{cases}y_1=-6x+25\\ y_2=2x-1\end{cases}||
To find the solution point of the system, a table of values can be made using the two equations. Construct a “double” table of values to make identifying the solution point easier.
In the table of values, when |x| has values less than or equal to |3,| we get |\color{green}{y_1}>y_2,| whereas, when |x| has values greater than or equal to |4,| we get |y_1<\color{green}{y_2}.| Therefore, the value sought is located between |3| and |4.| To find the solution point, we will have to zero in on this point in the following way.
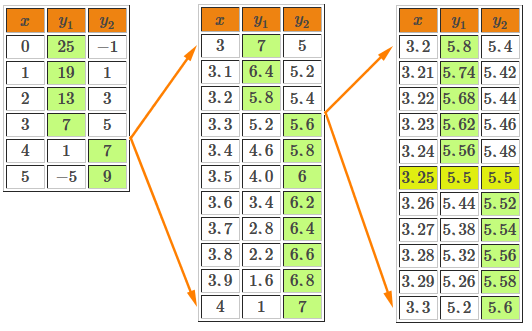
In the example, we had to decrease the step variation twice to find the solution point. Note that for the same value of |x| |(x=3.25),| we obtain identical values for the dependent variables of the two equations |(y=5.5).| Therefore, the solution point of the system is |(3.25,5.5).|