Subjects
Grades
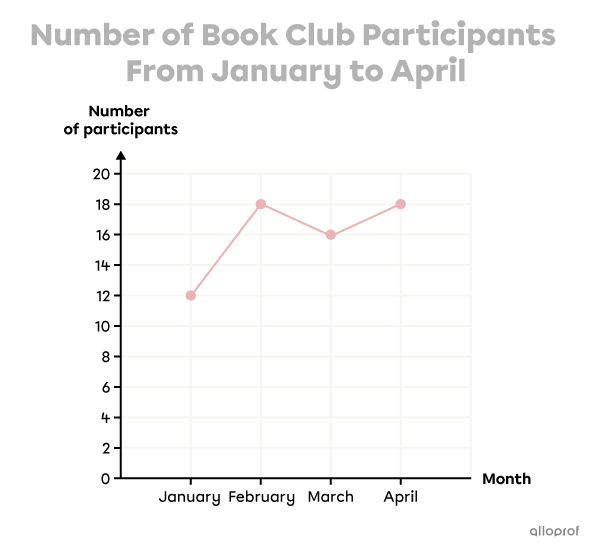
A broken line graph shows the results of a survey as a broken line that changes over time (months, days, hours, etc.).
Example:
The title of a broken line graph presents the subject of a study.
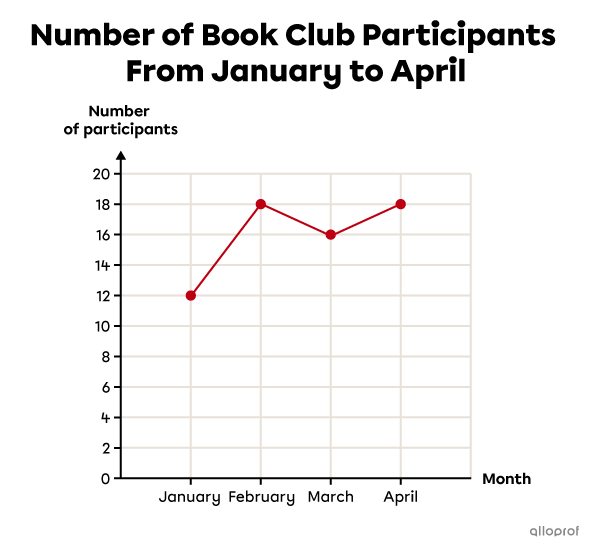
The title indicates that this broken line graph represents the number of book club participants from January to April.

A broken line graph has 2 axes: the vertical axis and the horizontal axis. Each axis is labelled to show what it represents.
The horizontal axis represents time units. It shows when and how often the data was collected.
The vertical axis represents the number of each of the data values collected.
In this graph, the horizontal axis shows the time in months. Data was collected once a month from January and April.
The vertical axis shows the number of book club participants.
The scale on each of the axes must have equal intervals.
The intervals between the numbers on the vertical axis of this broken line graph are + 2. The horizontal axis increases one month at a time. (+1)

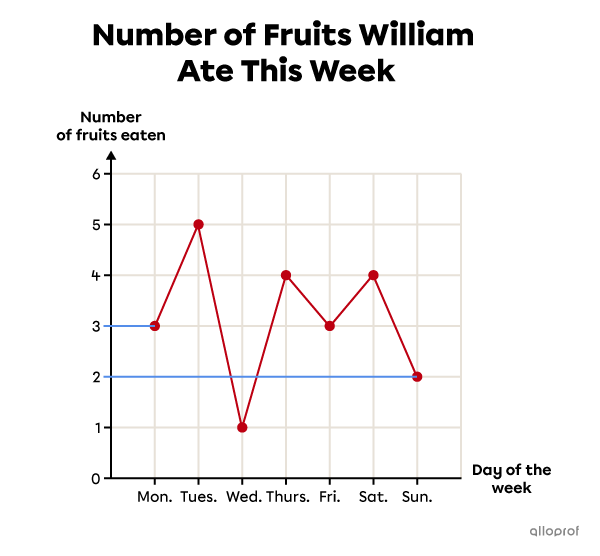
In a broken line graph, the data values (results) are represented by points connected by segments. The number associated with the position of each point indicates the amount of the data for each unit of time.
You can see the position of the point for Monday corresponds to 3 on the vertical axis. This lets you know that William ate 3 fruits on Monday.
The position of the point for Sunday corresponds to 2 on the vertical axis. This means that William ate 2 fruits on Sunday.
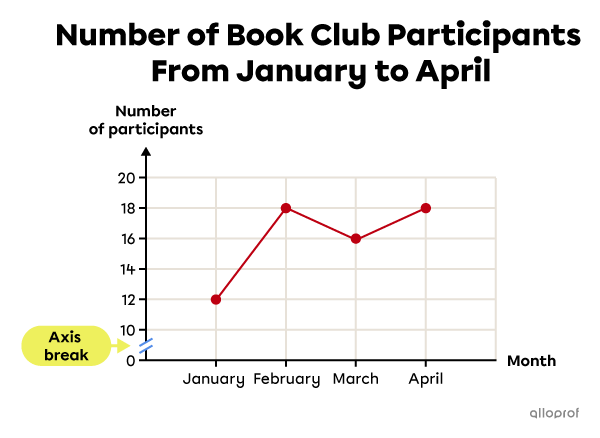
The vertical axis normally starts at 0. However, it is possible to make a larger jump between 0 and the first value by placing an “axis break.”
Example:
To interpret a broken line graph, you must analyze all the parts of the graph while keeping the question of the study in mind.
What was the warmest day this week?

| 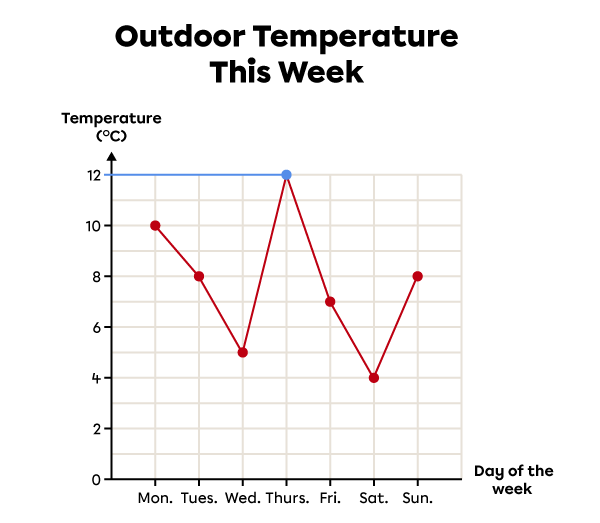 |
| 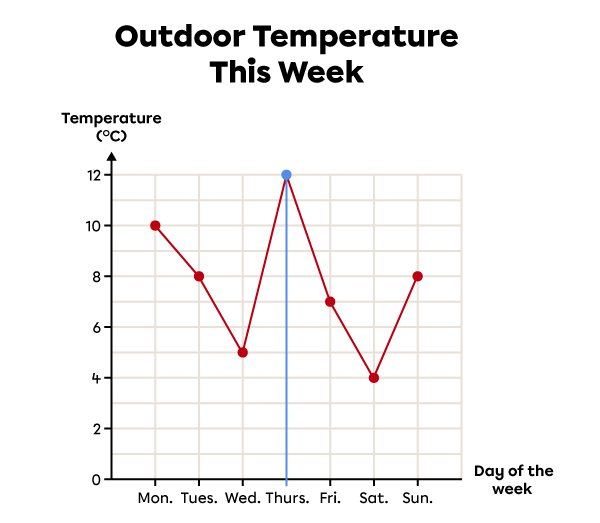 |
The warmest day was Thursday.
What was the temperature on Wednesday?
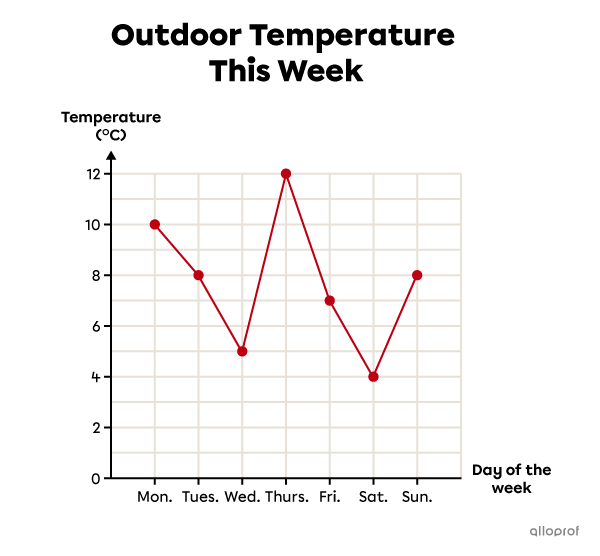
| 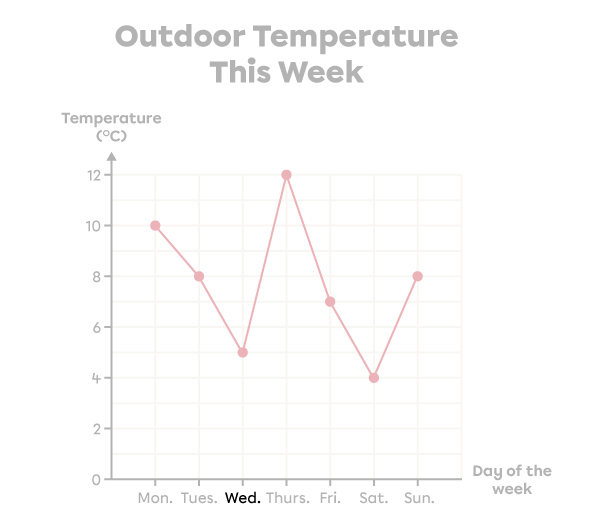 |
| 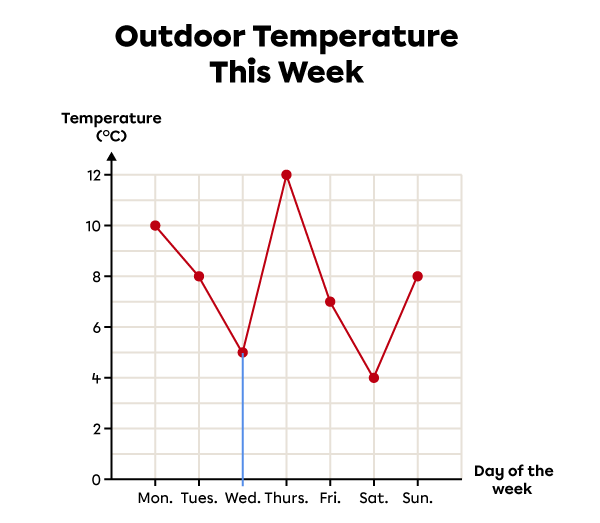 |
| 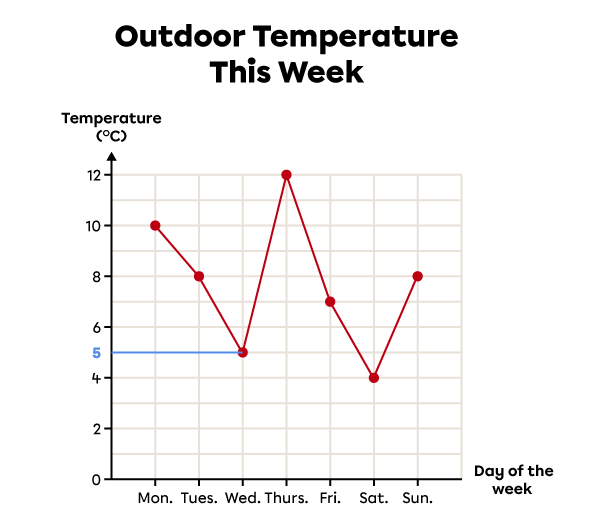 |
On Wednesday, the temperature was 5 degrees Celsius.