Subjects
Grades
Probability is the branch of mathematics that aims to measure the possibility of random events.
Calculating a probability is a matter of quantifying the possibility that an event will occur in a random experiment. This probability varies according to the event studied and the type of probability sought. To calculate probability, you have to analyze one-step or multi-step random experiments to enumerate all possible outcomes in the sample space. Furthermore, for various games of chance, we can determine the odds of winning or losing and calculate the expected gain or loss.
A random experiment is an experiment in which the outcome depends entirely on chance and the possible outcomes are known.
The sample space |\boldsymbol{(\Omega)}| is the set of all possible outcomes of a random experiment.
An event is a subset of the sample space of a random experiment.
A probability is a value between |0| and |1| |(0\ \%| and |100\ \%)| that quantifies the possibility of getting a specific outcome out of all possible outcomes.
An event can involve a single outcome, several outcomes or all the outcomes in the sample space. It may also correspond to no outcome.
The probability of an event is the ratio of the number of favourable outcomes to the total number of possible outcomes of the random experiment.
||\text{Probability}=\dfrac{\text{Number of Favourable Outcomes}}{\text{Number of Possible Outcomes }}||
Rolling a |6|-sided die is a random experiment, because all possible outcomes are known in advance and only depend on chance.
The sample space of this experiment is |\Omega=\{1, 2, 3, 4, 5, 6\}.|
The event |A| "getting a multiple of 3" corresponds to a subset of the sample space. ||A=\{3,6\}||
The probability of event |A| can be calculated as the ratio of the number of elements in set |A| to the number in set |\Omega.|
||P(A)=\dfrac{2}{6}=\dfrac{1}{3}||
A random experiment can be performed in one step (simple random experiment) or in multiple steps (compound random experiment).
It is useful to employ different modes of representation (tree diagrams, Venn diagrams, etc.) and the multiplication rule to enumerate all the outcomes of a random experiment.
If a random experiment has several steps, the sample space is written by placing the outcomes of each step in brackets.
Two coins are tossed and we are interested in the possible outcomes.
This is a 2-step random experiment.
The sample space is as follows:
||\Omega =\{(\text{T},\text{T}), (\text{T},\text{H}), (\text{H},\text{T}), (\text{H},\text{H})\}||
where
|\text{T}:| Tails
|\text{H}:| Heads
Event |B| "Getting Heads at least once" is a subset of |\Omega.|
||B=\{(\text{T},\text{H}), (\text{H},\text{T}), (\text{H},\text{H})\}||
We count |3| favourable results for event |B| and |4| possible outcomes in the set |\Omega.|
So the probability of getting Heads at least once is as follows:
||P(B)=\dfrac{\text{Number of Favourable Outcomes}}{\text{Number of Possible Outcomes}}=\dfrac{3}{4}||
Games of chance are random experiments. There are many such experiments. Here are some examples that are often used to study probability.
A traditional deck of cards is used to play many games such as poker, blackjack, war, solitaire, queen of spades, crazy 8s, 9s, 500s, etc.
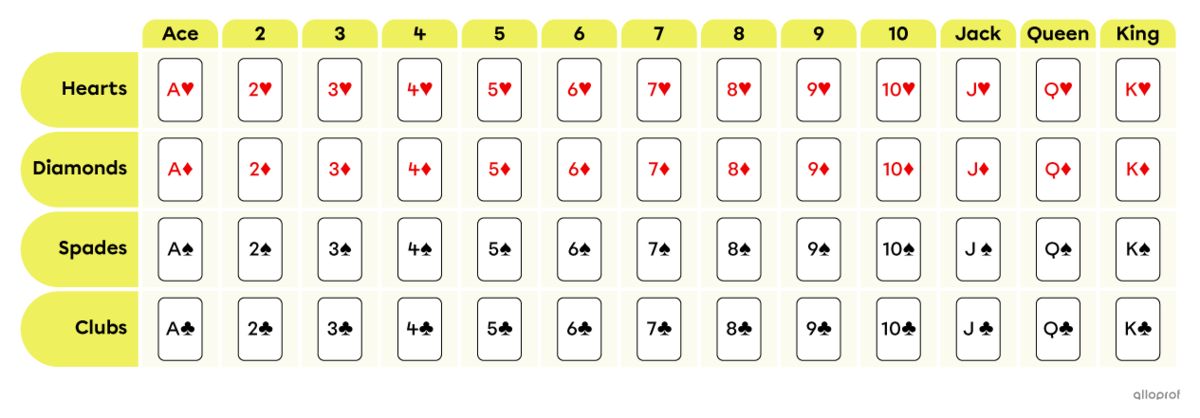
These are the characteristics of a 52-card deck.
There are 4 suits: hearts and diamonds which are red, and spades and clubs which are black.
Each suit has 13 cards:
One ace (A)
Numbered cards from 2 to 10
Three face cards: Jack (J), Queen (Q) and King (K)
In other words, each pack of cards has four jacks, four queens, four kings and four aces. The same applies to the numbered cards. The jacks, queens and kings form what are called face cards. In a 52-card deck, there are 12 face cards in total.
Note: In Quebec, we sometimes encounter French card decks. Instead of J, Q and K for Jack, Queen and King, we instead have V, D, and R for Valet, Dame, and Roi.
Here is a table that summarizes all the cards.
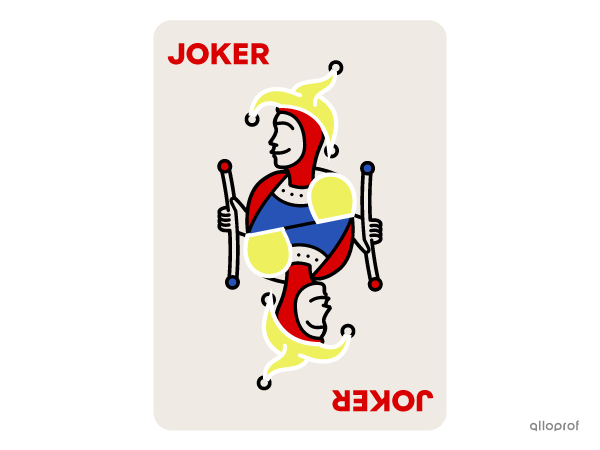
Note: Sometimes a 54-card deck is used. This is the same pack of cards to which 2 cards are added: the jokers. These are not part of any suit. Unless otherwise stated, jokers are not taken into account in probability questions.
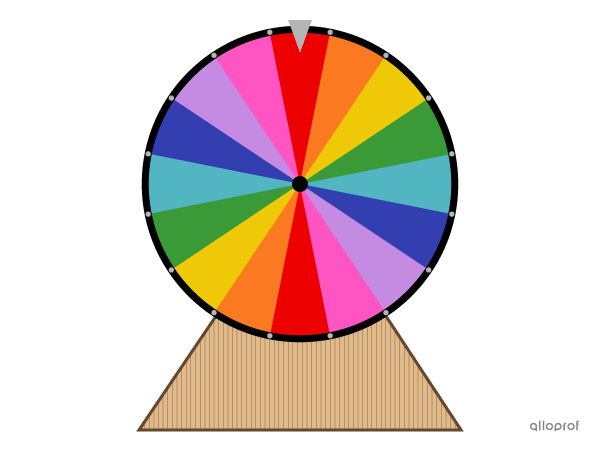
There are several games of chance based on a roulette wheel.
On television, we often see a vertically placed roulette wheel, which is called a lucky wheel. All you have to do is spin the wheel. When it stops spinning, you can see which sector of the circle the little arrow is pointing to and win the prize indicated there.
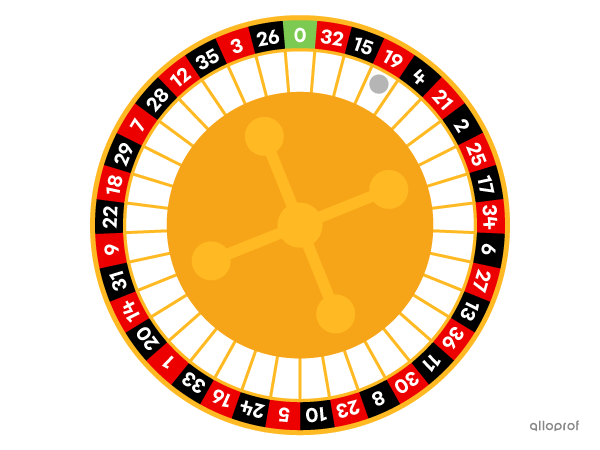
In casinos, the game is played with a roulette wheel placed flat on a table. A player can bet on one or more numbers, on a colour, etc. The roulette wheel is then spun as a ball is dropped onto it. When the roulette wheel stops spinning, the casino pays out to all those who made winning bets according to the following principle: the smaller the probability of the event on which you bet, the greater the winnings.
Note: Most roulette wheels are made up of identical circle sectors, so the probability of each sector is equal. Sometimes the sectors are not identical, so attention must be paid to the central angle of each sector.
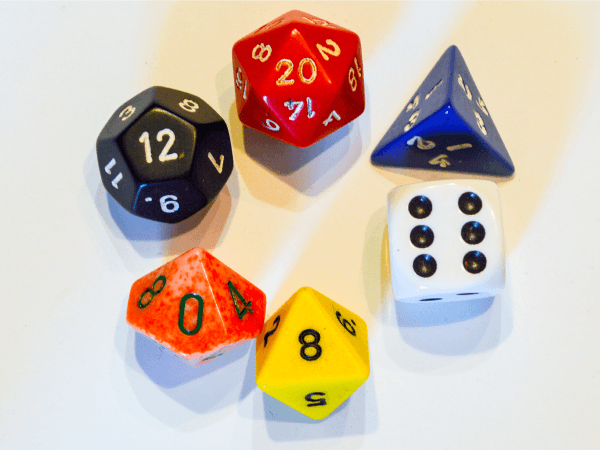
There are several types of dice. There are dice with 4, 6, 8, 10, 12 and 20 sides.
In a given problem, if not specified, it can be assumed that the die is a regulation 6-sided die. A 6-sided die is fair (standard) if the sum of two opposing sides is always 7. In other words, the 1 and the 6 are on opposite sides. The same applies to the pair (2, 5) and the pair (3, 4).
A die can also be rigged or loaded. It is loaded if its sides are not distributed in the correct way or if the mass of the die is not evenly distributed. For example, if the die is heavier on the 1 side, the die will have a greater tendency to come to rest on that side than on the other sides.
Many random experiments are conducted by random draw.
Here are some examples:
Drawing of a participation prize
Bingo: balls are drawn from a pool of balls until there is a winner. It is a multi-step random experiment.
Traditional lotteries: these are multi-step random experiments. For example, in the 6-49 lottery, 6 balls are drawn from a pool of 49 balls.
Etc.