Subjects
Grades
A table of values is a tool used to organize and present the results of a survey.
A table of values can be presented in two ways: horizontally or vertically.
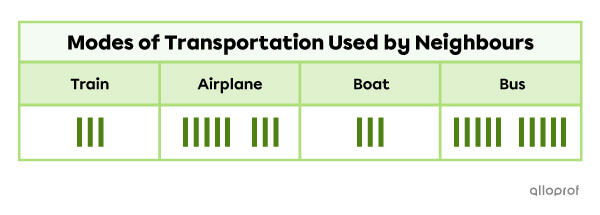
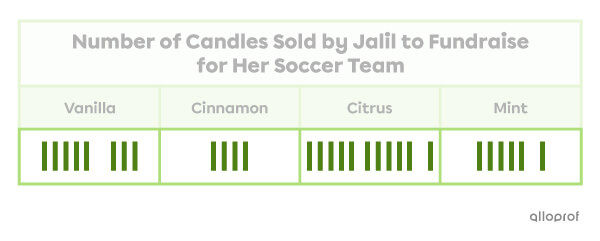
Horizontal table of values
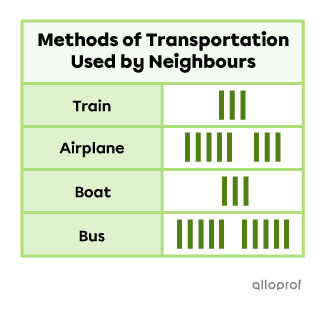
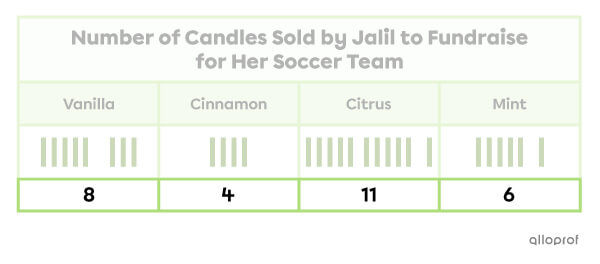
Vertical table of values
A table of values always has a title that introduces the survey’s topic.
The title indicates that this table represents the number of candles that Jalil sold to fundraise for her soccer team.
The categories in a table of values display the information collected.
This table shows the number of vanilla, cinnamon, citrus and mint scented candles sold by Jalil.
In a table of values, the data (results) can be represented in different ways. Tally marks (small lines), X’s or checkmarks can be used.
The data in this table are represented by tally marks.
There are 8 tally marks under the Vanilla category. This shows that Jalil sold 8 vanilla candles.
Some tables indicate the total amount of data collected for each category.
This table shows that Jalil sold 8 vanilla candles, 4 cinnamon candles, 11 citrus candles and 6 mint candles.
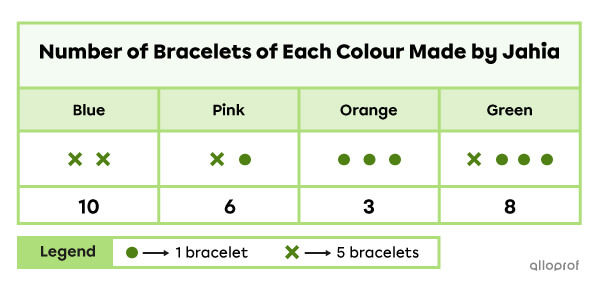
Some tables may have a legend. Look at the value associated with each symbol in the legend to know what they represent.
Example:
The legend shows that one dot represents 1 bracelet and that one X represents 5.
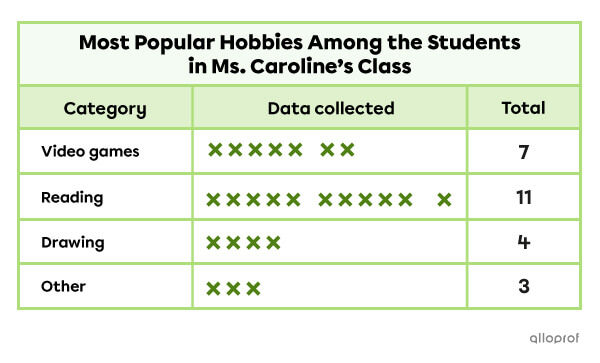
To interpret the data in a table of values, analyze all parts of the table while keeping the survey question in mind.
What is the most popular hobby among the students in Ms. Caroline’s class?
|  |
| 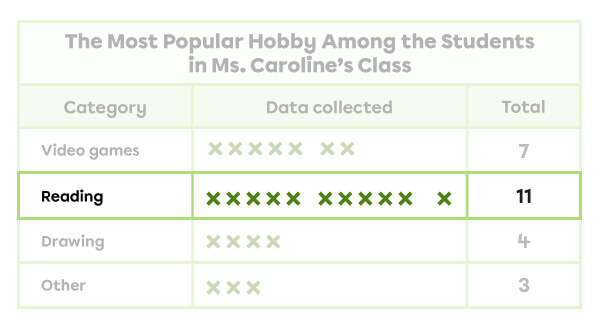 |
The most popular hobby in Ms. Caroline’s class is Reading.
How many students are there in Ms. Caroline’s class?

| 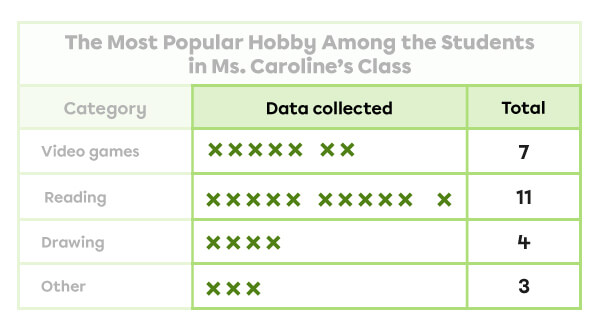 |
| 7 + 11 + 4 + 3 = 25 |
There are a total of 25 students in Ms. Caroline’s class.
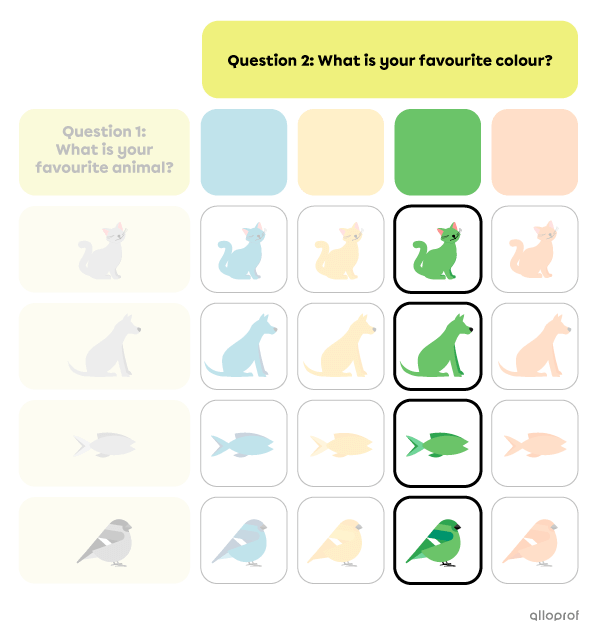
A double entry table is a tool used to organize and present the results of a survey with 2 questions.
Marie asks the students in her class to answer the 2 following questions:
All the possible choices are shown in the double entry table below.
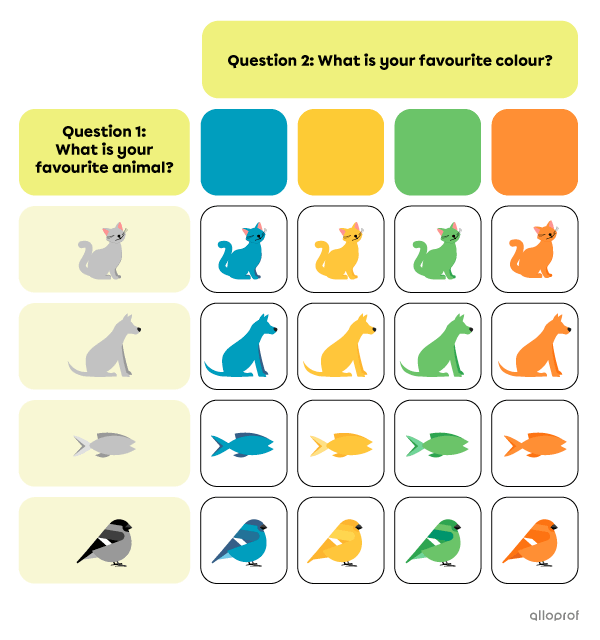
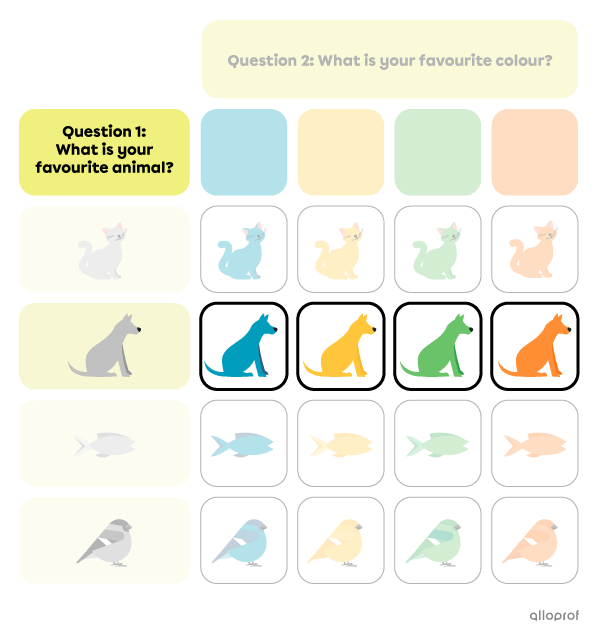
To read a double entry table, you have to identify the box in the table where the row and the column meet.
Julien's favourite animal is dogs and his favourite colour is green.
Identify the box that corresponds to Julien's choices in the double entry table below.
|  |
|  |
| 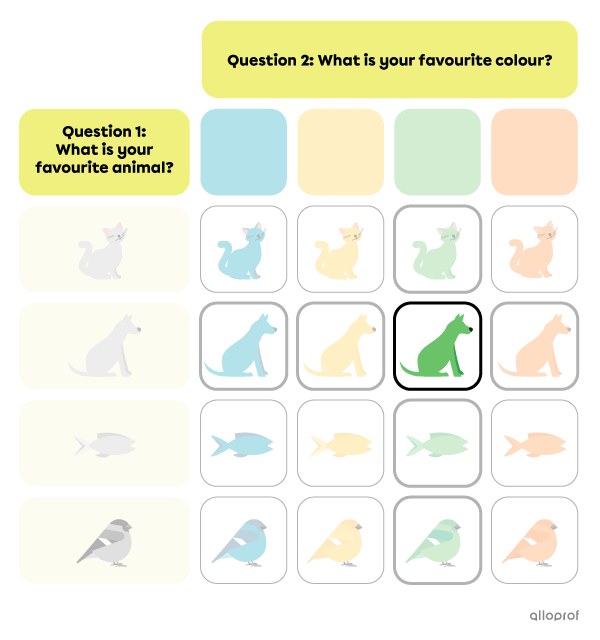 |
The box in the double entry table that corresponds to Julien's 2 choices is therefore the one that contains a green dog.