Subjects
Grades
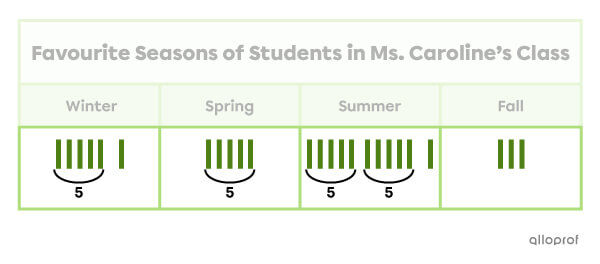
A table of values is a tool used to organize and present survey data.
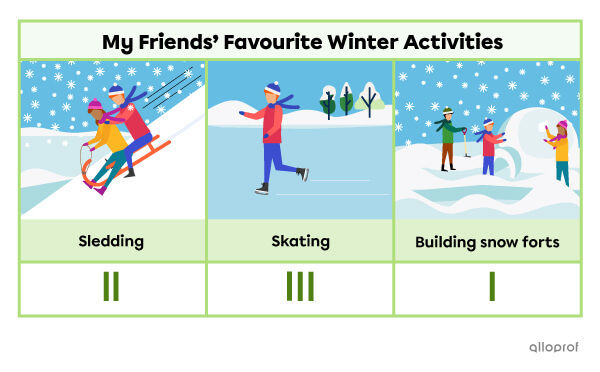
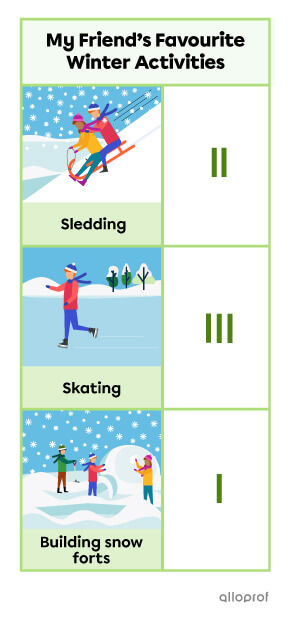
A table can be presented in two ways: horizontally or vertically.
Horizontal table of values
Vertical table of values
A table of values always has a title that introduces the survey’s topic.
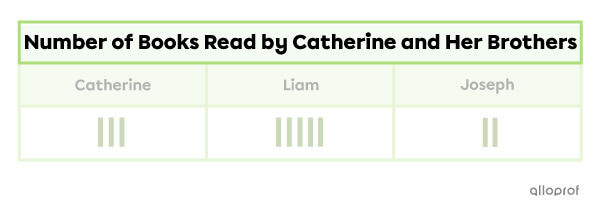
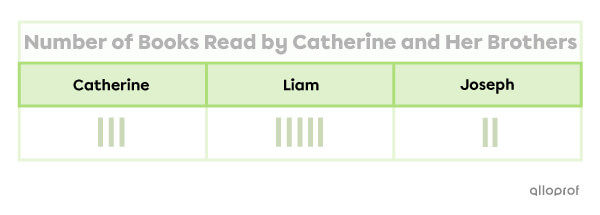
The title indicates that this table represents the number of books read by Catherine and her brothers.
The categories in a table of values display the information collected.
This table shows the number of books read by Catherine, Liam and Joseph.
In a table of values, the data (results) can be written in different ways. Tally marks (small lines), X’s or checkmarks can be used.
The data in this table are represented by tally marks.
I see that there are 3 lines under the Catherine category. This shows that Catherine has read 3 books.

The data can be grouped by 5’s to count the total faster.