Subjects
Grades
In an ordered distribution, a percentile rank is a measure of position used to compare one data value to the others.
The percentile rank of a data value |x| is the percentage of data with a value less than or equal to |x.| The percentile rank of |x| is denoted by |R_{100}(x).|
Percentiles correspond to the |99| values that divide an ordered distribution into |100| groups, each containing approximately |1\ \%| of the data. Percentiles are numbered from |C_1| to |C_{99}.|
Data that have the same value are assigned the same percentile rank.
When looking for the percentile rank of a data value |x,| we use the following formula.
||R_{100}(x)=\dfrac{\begin{gather}\text{Number of data values}\\\text{that are less than }x\end{gather}+\dfrac{1}{2}\left(\begin{gathered}\text{Number of data values}\\\text{that are equal to }x\end{gathered}\right)}{\begin{gather}\text{Total number of data values}\end{gather}}\times100||
If the answer is not a whole number, then we must round up to the nearest one.
In a class of |30| students, Martine scored |83\ \%| on her last math exam, which was the 4th best grade in the group. In addition, she was the only student to get this grade.
What is Martine's percentile rank?
According to the information provided, |26| students |(30-4)| scored less than |83\ \%.| Also, only one student (Martine) scored exactly |83\ \%.|
We can calculate Martine's percentile rank using the formula.||\begin{align}R_{100}(\text{Martine})&=\dfrac{\begin{gather}\text{Number of grades}\\\text{less than }83\ \%\end{gather}+\dfrac{1}{2}\left(\begin{gathered}\text{Number of grades}\\\text{equal to }83\ \%\end{gathered}\right)}{\begin{gather}\text{Total number of grades}\end{gather}}\times100\\&=\dfrac{26+\dfrac{1}{2}(1)}{30}\times100\\&=88.\overline{3}\end{align}||Rounding up to the nearest whole number gives |89.|
Answer: Martine occupies the 89th percentile rank, which we denote |R_{100}(\text{Martine})=89.|
The context of a situation must always be taken into account when studying the percentile rank of a data value. The better or higher performing the data value being studied is, when compared with the other data, the higher its percentile rank will be.
In the previous example, students were classed according to their score out of |100.| So the higher a student's grade, the better they performed, and therefore the higher their percentile rank.
On the other hand, we could be interested in race participants, where competitors are classed according to the time they take to cover the distance. In this type of situation, the shorter a participant's time, the better they perform, and therefore the higher their percentile rank.
There were |312| participants in the last great cycling tour of Lac Mégantic. Danny crossed the finish line at the same time as |5| other people, meaning they shared the 89th position in the standings.
What is Danny's percentile rank?
According to the information provided, |218| cyclists |(312-88-5-1)| crossed the finish line after Danny. From the 312 cyclists, we have to subtract the 88 who arrived before Danny, the |5| who arrived at the same time as him and Danny himself.
Danny's percentile rank is calculated using this formula:||\begin{align}R_{100}(\text{Danny})&=\dfrac{\begin{gather}\text{Number of cyclists}\\\text{that finished after the }89^\text{th}\ \text{position}\end{gather}+\dfrac{1}{2}\left(\begin{gathered}\text{Number of cyclists}\\\text{in }89^\text{th}\ \text{position}\end{gathered}\right)}{\begin{gather}\text{Total number of cyclists}\end{gather}}\times100\\&=\dfrac{218+\dfrac{1}{2}(6)}{312}\times100\\&=70.8\overline{3}\end{align}||Rounding up to the nearest whole number gives |71.|
Answer: Danny occupies the 71st percentile, which is denoted by |R_{100}(\text{Danny})=71.|
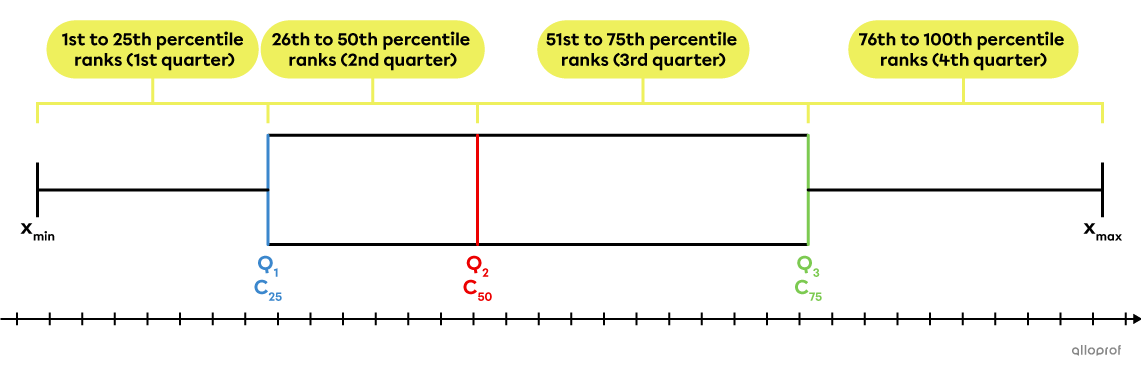
It is possible to convert percentile ranks into quarters and the percentiles into quartiles.
The percentile ranks from 1 to 25 correspond to the 1st quarter.
The percentile ranks from 26 to 50 correspond to the 2nd quarter.
The percentile ranks from 51 to 75 correspond to the 3rd quarter.
The percentile ranks from 76 to 25 correspond to the 4th quarter.
The 25th percentile |(C_{25})| corresponds to the 1st quartile |(Q_1).|
The 50th percentile |(C_{50})| corresponds to the median |(Q_2).|
The 75th percentile |(C_{75})| corresponds to the 3rd quartile |(Q_3).|
These 2 concepts can be compared using a box and whisker plot.
When we are looking for the data value |x| that occupies a certain percentile rank, we must first calculate its position in the distribution using the following formula:
||\begin{gathered}\text{Position of }x\\\text{in the distribution}\end{gathered}=\dfrac{R_{100}(x)}{100}\times\begin{gather}\text{Total number}\\\text{of data values}\end{gather}||
If the answer is not a whole number, round down to the nearest whole number.
A survey measured the height, in centimetres, of the |124| 15-year-olds at Juliette's high school. Here is the resulting sample.||150,155,156,\!\!\!\!\!\!\underbrace{\ldots}_{\large{68\ \text{students}}}\!\!\!\!\!,167,167,168,169,170,170,170,171,\!\!\!\!\!\!\underbrace{\ldots}_{\large{42\ \text{students}}}\!\!\!\!\!,182,185,188||What is Juliette's height if she occupies the 61st percentile?
Calculate Juliette’s position in the list.
||\begin{aligned}\begin{gathered}\text{Juliette's position}\\\text{in the school}\end{gathered}&=\dfrac{R_{100}(\text{Juliette})}{100}\times\begin{gather}\text{Total number}\\\text{of data}\end{gather}\\&=\dfrac{61}{100}\times124\\&=75.64\end{aligned}||Rounding down to the nearest whole number, we find that Juliette would be the 75th data value. The position of the data value we're looking for is always found by counting from the worst-performing data value, which in this case is |150.| Therefore, the 75th data value is |169.|
Check the answer.
Check to make sure that |169| indeed occupies the 61st percentile.||\begin{align}R_{100}(\text{Juliette})&=\dfrac{\begin{gather}\text{Number of data values}\\\text{less than }169\end{gather}+\dfrac{1}{2}\left(\begin{gathered}\text{Number of data values}\\\text{equal to }169\end{gathered}\right)}{\begin{gather}\text{Total number of data values}\end{gather}}\times100\\&=\dfrac{74+\dfrac{1}{2}(1)}{124}\times100\\&\approx60.08\end{align}||Rounding up to the nearest whole number gives |61.| This is indeed the data value we're looking for: |169.|
Answer: Juliette’s height is |169\ \text{cm}.|
It is always best to check that the position obtained using the formula actually indicates the data value that occupies the percentile rank provided. It is possible that the data value you are looking for occupies the next position in the distribution.
To find the position of a data value in a condensed data distribution, we must use cumulative frequencies.
Here are the best results from a strongman competition where participants had to lift a |200\ \text{kg}| weight as long as possible.
|
Time (s) |
Number of participants |
Time (s) |
Number of participants |
|---|---|---|---|
|
|8.9| |
|10| |
|9.6| |
|24| |
|
|9| |
|15| |
|9.7| |
|22| |
|
|9.1| |
|23| |
|9.8| |
|20| |
|
|9.2| |
|26| |
|9.9| |
|17| |
|
|9.3| |
|27| |
|10| |
|10| |
|
|9.4| |
|25| |
|10.1| |
|5| |
|
|9.5| |
|24| |
|10.2| |
|2| |
What data value occupies the 25th percentile?