Subjects
Grades
Here is a short preparation guide containing all the concepts covered in Secondary 3. To explain everything, each formula will be followed by an example and a link that leads to a concept sheet in our virtual library.
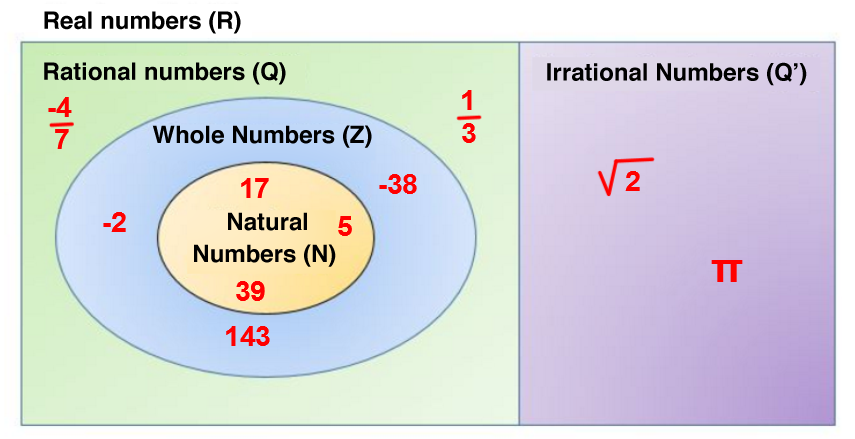
In this section, it is important to differentiate between the following sets:
|\mathbb{N} = | Natural numbers: Positive whole numbers.
|\mathbb{Z} = | Integers: Positive and negative whole numbers.
|\mathbb{Q} = | Rational numbers: Numbers that can be written as a fraction in the form |\frac{a}{b}| with |\{a, b\} \in \mathbb{Z}| and |b \neq 0.|
|\mathbb{Q}' = | Irrational numbers: Numbers that cannot be written as a fraction of the form |\frac{a}{b}| with |\{a,b\} \in \mathbb{Z}| and |b \neq 0.|
|\mathbb{R} = | Real numbers: Set of numbers that includes all the sets presented above.
We can also use the signs “*”, “+”, and “-” to refer to a set that does not contain the number 0, strictly positive numbers, or strictly negative numbers (e.g., |\mathbb{N} = \mathbb{Z}_+| ) .
What is the smallest number set that includes the following numbers: ||\{0{.}125\,\ 19\ \%\,\ 0{.}\overline{666}\,\ 30\}||
When subsets are written, it is important to respect the different notation conventions, as follows:
Intervals: Use square brackets to indicate the start and end of the subset.
List/Roster: Use set brackets to enumerate or list all numbers from the start to the end of the subset. If it is infinite, you can use an ellipsis (...).
Number line: Use a number line to represent the start and end of the subset.
Use all three notation methods to represent the following subset: ||-3 < x \leq 2{.}5||
To write a number in scientific notation, we use the notation |a \times 10^b| with |1\leq a <10| and |b \in \mathbb{Z}.|
Addition and subtraction
Multiplication and division
Using scientific notation, what is the result of the following chain of operations: ||(2{.}1 \times 10^5 + 4{.}2 \times 10^4) \times 8{.}43 \times 10^{12}||
To simplify an exponential expression, remember the laws of exponents:
|
|\left(\dfrac{a}{b}\right)^{-m} = \left(\dfrac{b}{a}\right)^m| |
|(ab)^m = a^m b^m| |
|
|a^{\frac{m}{n}} = \sqrt[n]{a^m}| |
|\left(\dfrac{a}{b}\right)^m = \dfrac{a^m}{b^m}| |
|
|a^m \times a^n = a ^{m+n}| |
|(a^m)^n = a^{m n}| |
|
|\dfrac{a^m}{a^n} = a^{m-n}| |
|a^0=1| |
Determine whether the following two exponential expressions are equal: ||\left(\dfrac{36c^4d^6}{e^8} \right)^{\frac{-1}{2}} = \dfrac{e^4}{18c^2d^3}||
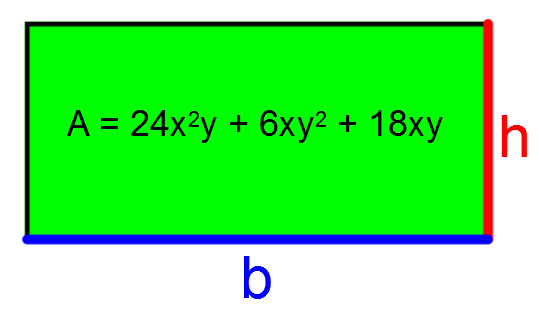
To factor out the Greatest Common Factor (GCF), locate a factor common to each of the terms that make up the initial algebraic expression. Once the common factor has been found, divide the algebraic expression by it and add brackets.
Study the following diagram and determine the algebraic expression associated with the base and height.
To solve an inequality, the same basic principles can be used as for solving an equation. However, special attention must be paid to the inequality symbol. When dividing or multiplying by a negative number, the direction of inequality sign must be reversed: ||-4x \leq 12\ \Rightarrow\ x \geq -3||
At the moment, if I double my age and add three it is equal to my brother's age. What are the different integers associated with my age if the sum of our two ages is less than 60?
To solve a system of equations by comparison, follow these steps:
Identify the variables related to the unknowns.
Create a system of equations according to the scenario.
Isolate the same variable for each equation.
Compare the two equations to form a new one.
Solve the new equation.
Substitute the value of the found variable in one of the starting equations to find the value of the other variable.
Answer the question.
At the corner store, a group of workers bought 4 coffees and 6 muffins for $15.06. The next day, the same group bought 3 coffees and 5 muffins for a sum of $11.97. On the following day, how much will the workers pay if they want to buy 6 coffees and 4 muffins?
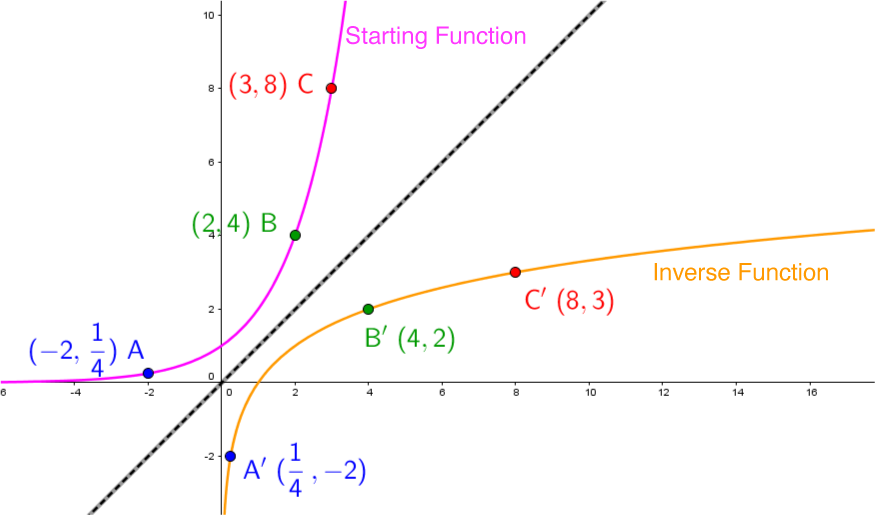
Each term is associated with a definition and a graphical representation:
Relation: For the same value of |x,| there may be more than one value of |y.|
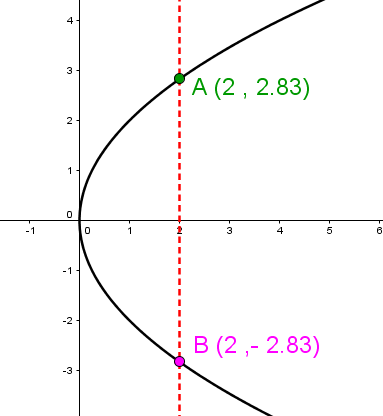
Function: For the same value of |x,| there is at most one value of |y.|
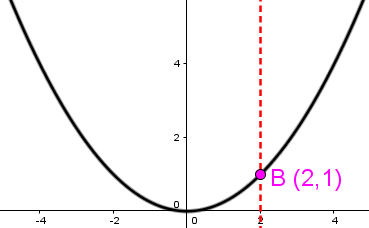
Inverse: Written |f^{-1}(x),| the inverse of a function consists of inverting the dependent and independent variables |\big((\color{blue}{x},\color{red}{y}) \mapsto (\color{red}{y}, \color{blue}{x})\big).|
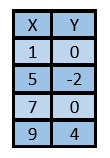
Using the following table of values, determine:
1) If it is a function or a relation.
2) The table of values which defines its inverse.
|\begin{align} f(x) &= ax + b \\\\ \text{where}\ a &= \dfrac{\Delta y}{\Delta x}= \dfrac{\color{red}{y_2}-\color{blue}{y_1}}{\color{red}{x_2}-\color{blue}{x_1}} \\ b &= \text{the initial value} \end{align}|
|\color{blue}{(x_1, y_1)}, \color{red}{(x_2,y_2)}| are points on the right.
To estimate the time necessary for cyclists to complete a stage, the leaders use the average speed of their progress and plot the following graph:
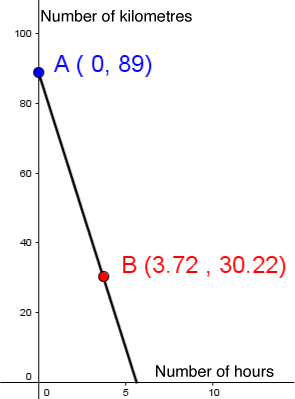
Determine the duration of the race using the information on the graph.
|\begin{align} y &= \dfrac{k}{x} \\\\ k &= x y \end{align}|
When awarding prizes for the weekly draw of a national lottery, the jackpot is equally divided amongst the number of winners. The following is an illustration of the latest payout:
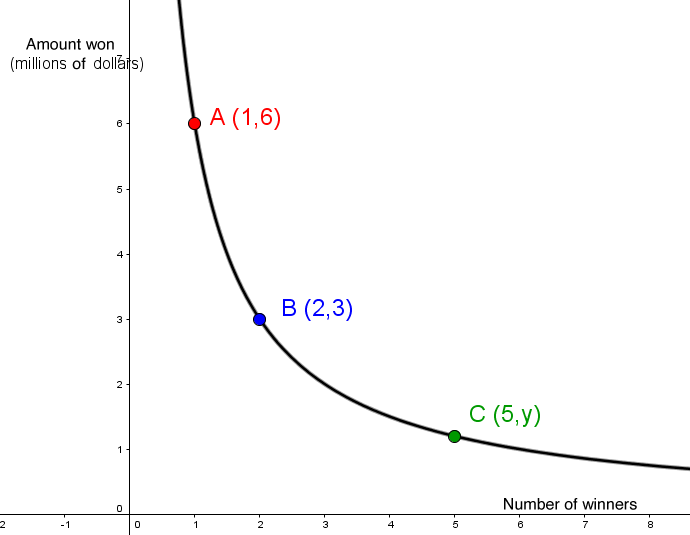
Based on this context, how much did each participant win if there were 5 winners?
There are two types of random variables |x| in probability:
Discrete: When |x \in \mathbb{N}|
Continuous: When |x \in \mathbb{R}_+|
In each situation, determine whether the variable is discrete or continuous.
Determine the probability based on the orientation (in degrees) of a pointer that is dropped on the ground.
Determine the probability based on the results of throwing a 6-sided die.
|\mathbb{P} = \dfrac{\text{Area of the desired region}}{\text{Area of the total region}}|
You want to win a unicorn toy as a souvenir of your evening at the fair. To win, you have to throw a ball and hit one of the large target’s red areas.
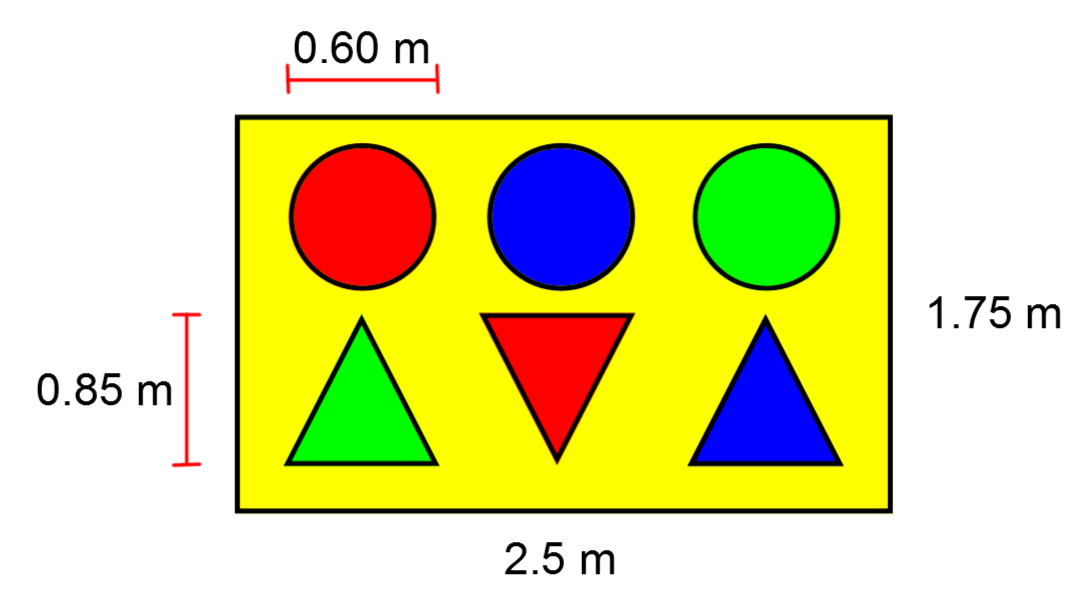
Based on those informations, what is the probability (as a percentage) that you leave with a unicorn toy if you throw the ball at random, givent that the measure of the triangles' bases are equivalent to the circles' diameter?
|\mathbb{P} = \dfrac{\text{Number of desired results}}{\text{Total number of results}}|
A company decides to market candy whose packaging consists of candy in the primary (blue, red, yellow) and secondary (green, orange, purple) colours.
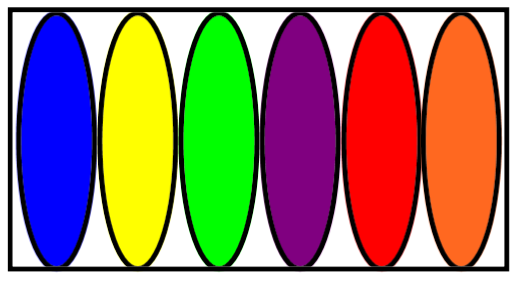
Assuming each package contains one candy of each color, what is the probability that you will start by eating a purple one and finish by eating a green one?
The following are the most common sampling methods:
Random: The elements are chosen at random, without precise methodology.
Systematic: The elements are chosen respecting a precise frequency.
Cluster: The elements are placed in subgroups without considering any specific characteristics, and the subgroups are then chosen at random.
Stratified: The elements are placed in subgroups according to a specific characteristic (e.g., age, height, weight, and so on).
Identify which method is the most appropriate for each situation.
1) We conduct quality control in a factory by checking 1 out of every 100 products that leave the production line.
2) We conduct a survey of people in the same neighborhood to try to predict the results of the next election.
3) A dealership surveys people between the ages of 30 and 40 to make significant changes to their next vehicle model.
||\text{Weighted mean} = x_1 p_1 + x_2 p_2 +\dots + x_i p_i|| where ||\begin{align} x_i &: \text{Result}\\ p_i &: \text{weight of result} \end{align}||
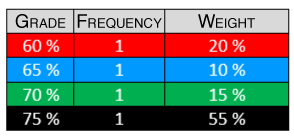
Based on the distribution table above, calculate the weighted mean.
In this type of table, the data is grouped into intervals of the same range. The median of each interval is used to perform the various measures of central tendency calculations.
To properly analyze the student results in groups, a teacher sorts the data in the following distribution table:
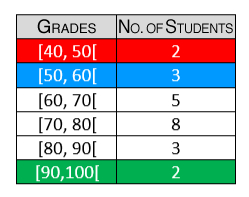
Based on the information, the teacher determines the following:
1) The modal class
2) The medial class
3) The mean
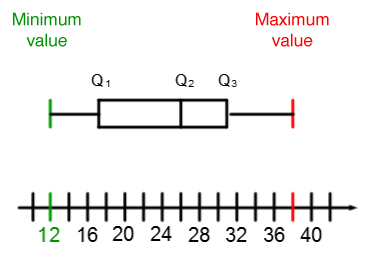
|Q_1 =| 1st quartile |=| Median of the first half of the distribution
|Q_2=| 2nd quartile |=| Median of the entire distribution
|Q_3 =| 3rd quartile |=| Median of the second half of the distribution
|Q_3 - Q_1=| Interquartile range
Due to its construction criteria, each section of the quartile diagram contains about 25% of the data in the distribution.
Using the following quartile diagram, determine if the statements are true or false and justify each of your answers.
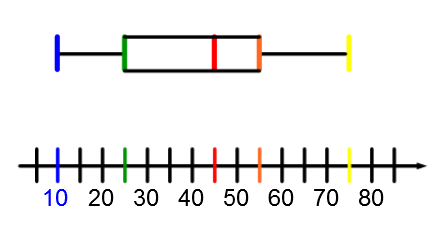
1) About |50\ \%| of the data is included between |\color{green}{25}| and |\color{orange}{55}.|
2) The interquartile range is |65|.
3) There is more data between |\color{green}{25}| and |\color{red}{45}| than between |\color{red}{45}| and |\color{orange}{55}.|
4) The mean of the distribution is |\color{red}{45}.|
To build a scatter plot, simply place each of the points found in the same context on a Cartesian plane by identifying them with a point.
To have a better idea of his players’ performance progress, a hockey coach analyzes the number of games played and the number of points obtained during the last three seasons.
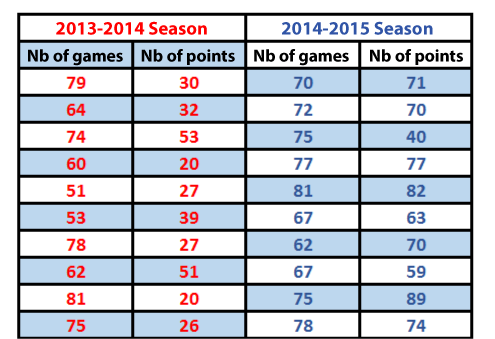
Construct a scatter plot with all the data to help sort it all out.
|
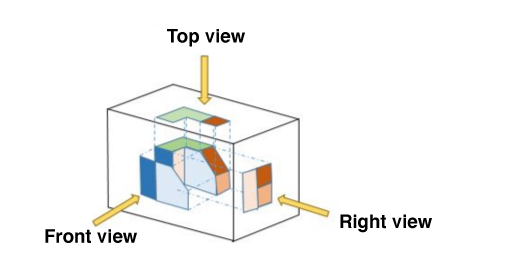
Orthogonal projections (various views) |
|
|---|---|
 |
|
| Parallel projections | |
|
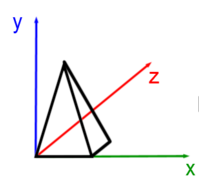
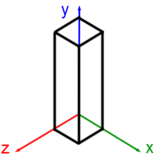
Isometric perspective (only the front face is not deformed) |
Axonometric perspective (edge measurements proportional to reality) |
 |
 |
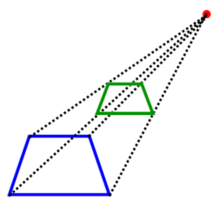
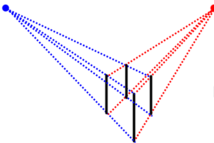
| Central projections | |
| Perspective with a vanishing point | Perspective with two vanishing points |
 |
 |
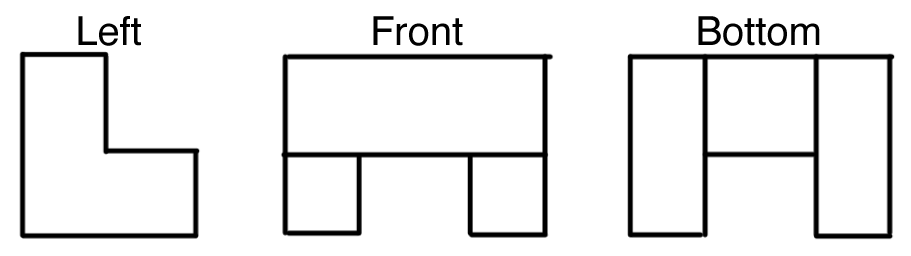
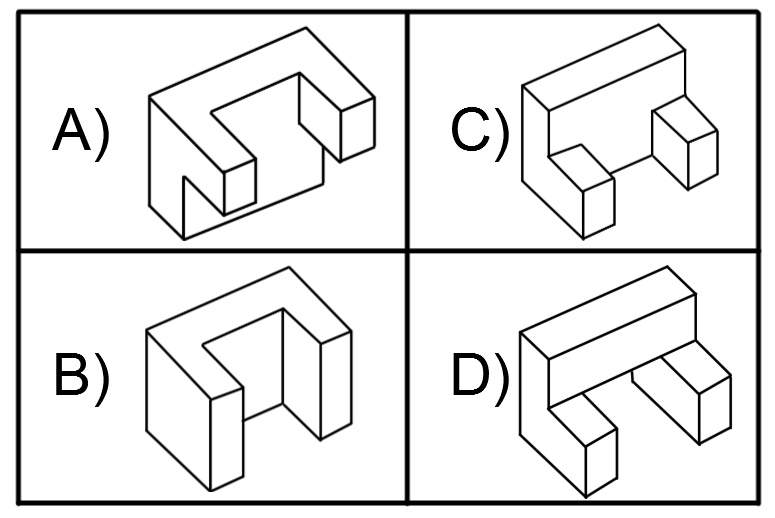
Based on the different views of an orthogonal projection presented above, which of the following solids can be associated with it?
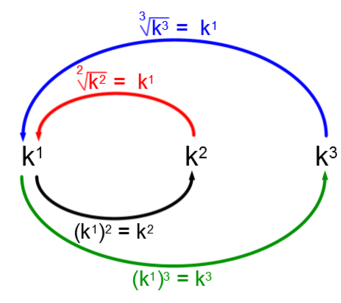
|\text{Similarity ratio} = \dfrac{\text{Image figure dimensions}}{\text{Initial figure’s corresponding dimensions}}=k^1|
|\text{Ratio of Areas} = \dfrac{\text{Image figure area}}{\text{Initial figure area}}=k^2|
|\text{Ratio of Volumes} = \dfrac{\text{ volume of the image solid}}{\text{volume of the initial solid}}=k^3|
The arithmetic associations existing between each of the ratios are:
To keep every customer happy, a company sells party hats in two sizes: one for adults and one for kids. The height of the adult size is 7 cm higher than the child version.
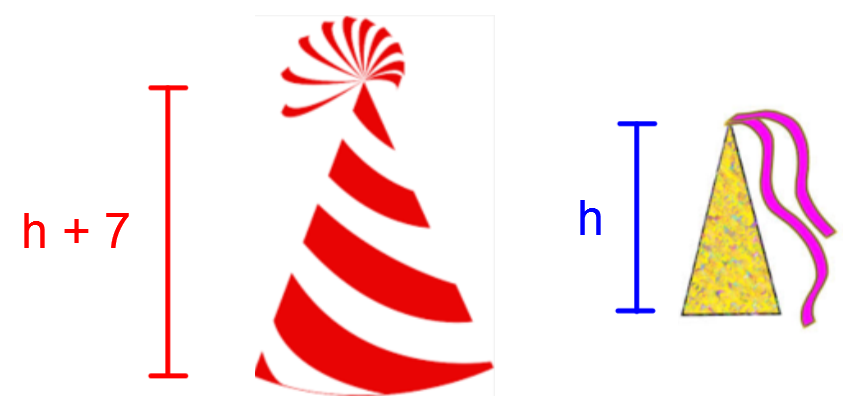
Given that the ratio of the hat’s respective lateral areas is |\dfrac{49}{25},| what are the heights of both hats?
Since we are dealing with a decomposable solid, it’s better to work with the area of each of the solid’s faces rather than the total area of each of the solids that compose it. In other words, the area formulas of plane figures are preferred.
|
|A_\text{square} = s^2| |
|A_\text{rectangle} = b\times h| |
|A_\text{rhombus} = \displaystyle \frac{D \times d}{2}| |
|
|A_\text{parallelogram}=b \times h| |
|A_\text{trapezoid} = \displaystyle \frac{(B+b)\times h}{2}| |
|A_\text{triangle} = \displaystyle \frac{b \times h}{2}| |
|
|A_\text{circle}=\pi r^2| |
|A_\text{regular polygon}= \displaystyle \frac{s a n}{2}| |
|A_\text{cone}= \pi r^2 + \pi r a| |
|
|A_\text{cylinder}=2\pi r^2 + 2\pi r h| |
||
As a collector is browsing an antique store, she sees a chest. If she buys it, she will need to know its total height because it must be similar to the ones she already owns. For restoration purposes, the total area is known.
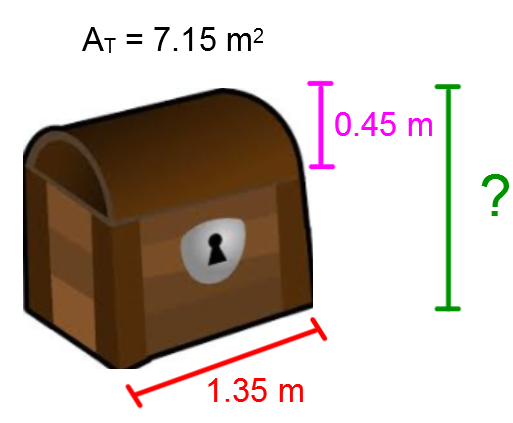
What is the total height of the chest?
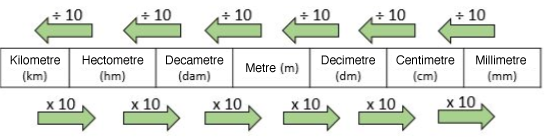
Length units
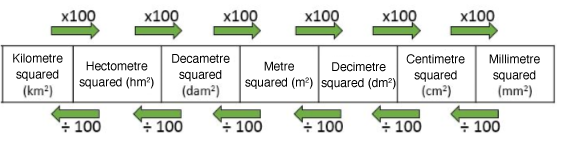
Area units
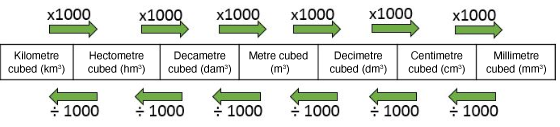
Volume units
Capacity units
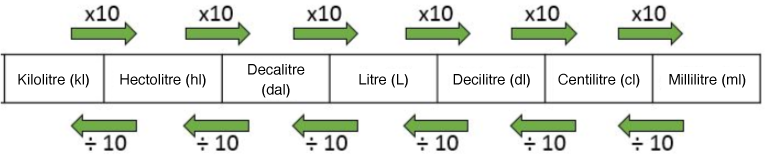
Volume and capacity
|
|1 \ \text{kL} = 1 \ \text{m}^3| |
|1 \ \text{L} = 1 \ \text{dm}^3| |
| 1 \ \text{mL} = 1 \ \text{cm}^3| |
A few years ago, a municipality offered to help people fill their pools. To avoid waste, the city provided free help from firefighters for the first |\color{blue}{5 \ 000}\ \text{L}| of water. For the rest, the city charged a fee of |$0{.}002\ | per additional litre.
How much would it cost to fill a swimming pool with a volume of |\color{red}{22 \ \text{m}^3}|?
To calculate the volume of decomposable solids, it is important to remember the formulas for the volume of solids.
|
|V_\text{prism} = A_b \times h| |
|V_\text{cube} = s^3| |
|V_\text{pyramid} = \displaystyle \frac{A_b \times h}{3}| |
|
|V_\text{cylinder} = \pi r^2 \times h| |
|V_\text{sphere} = \displaystyle \frac{4 \pi r^3}{3}| |
|V_\text{cone} = \displaystyle \frac{\pi r^2 \times h}{3}| |
After making several purchases at your favorite furniture store, you use your own trailer to haul everything home. Due to regulations, your load must not exceed 3 m in height from the ground.
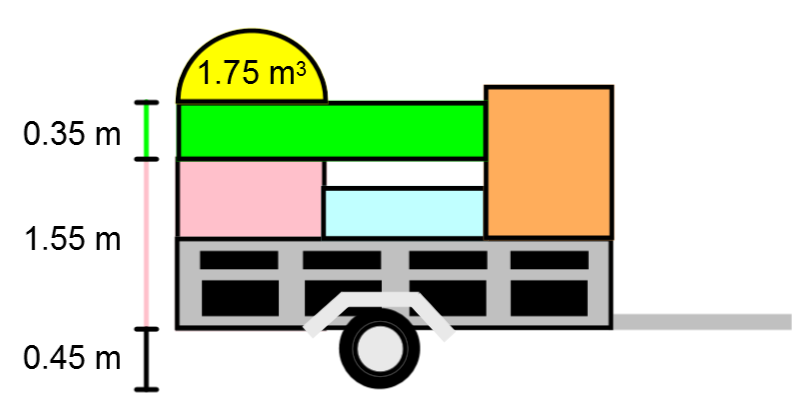
Based on the information you have, determine if your load is legal or not knowing that your trailer’s width is |\color{blue}{1{.}5}\ \text{m}.|
|\color{blue}{a}^2 + \color{red}{b}^2 = \color{green}{c}^2|
Where
|\color{blue}{a}| and |\color{red}{b} = | measurement if the sides
|\color{green}{c} = | measurement of the hypotenuse
To save people from a fire, firefighters want to install a temporary bridge to allow people to pass from the burning building to safety.
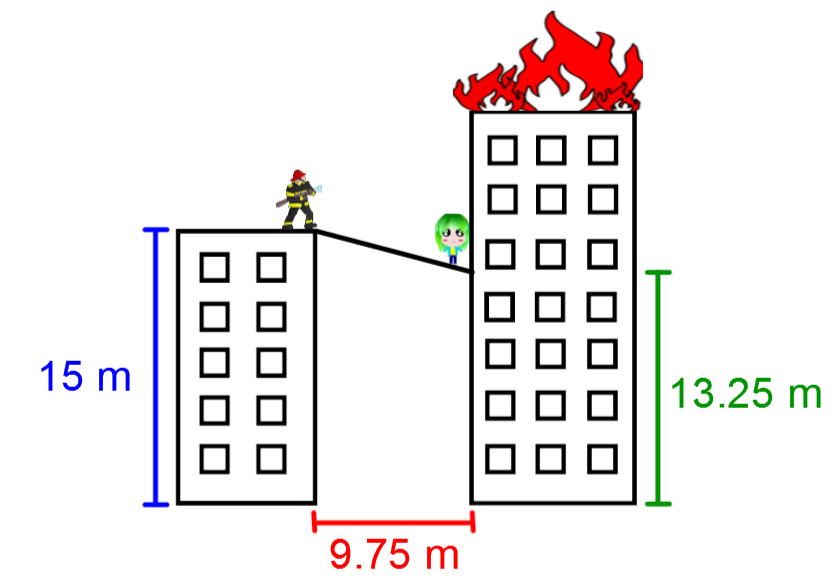
Based on the information in the drawing, what should be the minimum length of the bridge?