Subjects
Grades
The cosine function is a periodic function represented by a repeating pattern called a cycle. To graph a cosine function, construct a rectangle to frame one cycle and then reproduce it.
Before sketching the function, it is necessary to define certain terms and their links with the parameters |a,| |b,| |h,| and |k| from the rule of the cosine function: |f(x)=a\cos\!\big(b(x-h)\big)+k.|
|
Definitions |
Links with Parameters |
|---|---|
|
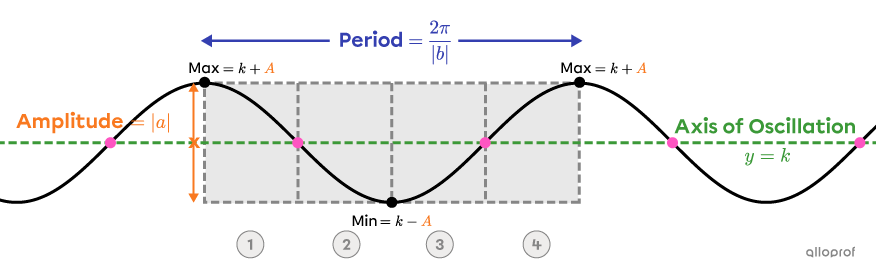
The period |\color{#333fb1}{(p)}| is the difference between the 2 |x|-values at the extremities of a cycle. The length of the rectangle is equal to the period. |
The period is determined from parameter |b.| |
|
The axis of oscillation (also called the midline) corresponds to the horizontal line intersecting the middle of the function. |
The axis of oscillation is determined from parameter |k.| |\color{#3a9a38}{\text{Axis of Oscillation}}:| |y=k| |
|
The inflection points are all the points intersecting the axis of oscillation. The extrema are the points located at the maximum and minimum of the function. |
In one cycle, there are 2 inflection points and 3 extrema. |
|
The amplitude |\color{#fa7921}{(A)}| is the vertical distance between the axis of oscillation and an extremum. The height of the rectangle is equal to |2\color{#fa7921}A.| |
The amplitude is determined using parameter |a.| The extrema are determined using the amplitude and parameter |k.| |
To graph a cycle of a cosine function, start at a maximum or a minimum and end at the same height. The cycle is framed by a rectangle, determined by the period and amplitude. It is then divided into 4 equal parts, each one determined by an inflection point and a vertex.
Take the following steps to graph a cosine function.
Determine the amplitude, period, phase shift, and the axis of oscillation.
Determine the maximum and minimum.
Draw the axis of oscillation and horizontal lines at the maximum and minimum.
Draw the rectangle starting at |x=h| and divide it into 4 equal parts.
Determine the starting point using the sign of |a,| other vertices, and inflection points.
When |a| is positive, the cycle starts at |(h,k+A),| a maximum.
When |a| is negative, the cycle starts at |(h,k-A),| a minimum.
Sketch a first cycle and continue the curve on the rest of the Cartesian Plane.
Graph the cosine function with the rule |f(x)=-2\cos\left(\dfrac{\pi}{3}(x-1)\right)-3.|
Determine the amplitude, period, phase shift, and the axis of oscillation
From the rule, the following parameters can be identified: |a=-2,| |b=\dfrac{\pi}{3},| |h=1,| and |k=-3.|
|\begin{align}\color{#fa7921}A&=\vert a\vert \\&=\vert-2\vert\\ &=\color{#fa7921}{2}\end{align}|
|\begin{align}\color{#333fb1}p&=\dfrac{2\pi}{\vert b\vert}\\&=\dfrac{2\pi}{\vert\frac{\pi}{3}\vert}\\ &=2\pi \times \dfrac{3}{\pi}\\ &=\color{#333fb1}6\end{align}|
|\begin{align}\color{#a8a39e}{\text{Phase Shift}}&=h\\&=\color{#a8a39e}1\end{align}|
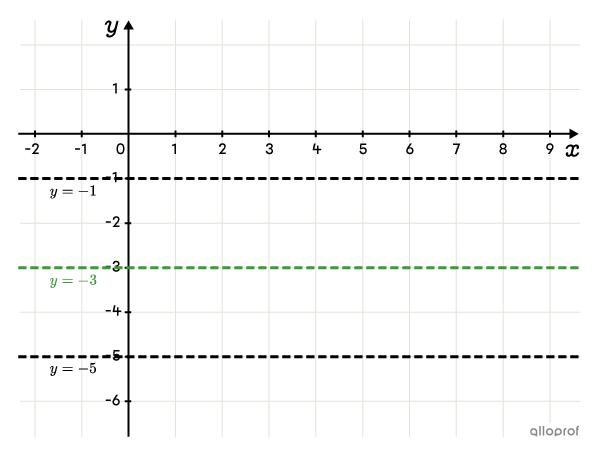
|\begin{align}\color{#3a9a38}{\text{Axis of Oscillation}}: y&=k\\ \color{#3a9a38}{y}&\color{#3a9a38}{=}\color{#3a9a38}{-3}\end{align}|
Determine the maximum and minimum
|\begin{align}\max&=k+\color{#fa7921}A\\&=-3+\color{#fa7921}{2}\\&=-1\end{align}|
|\begin{align} \min&=k-\color{#fa7921}A \\&=-3-\color{#fa7921}{2} \\&=-5\end{align}|
Draw the axis of oscillation and horizontal lines at the maximum and minimum
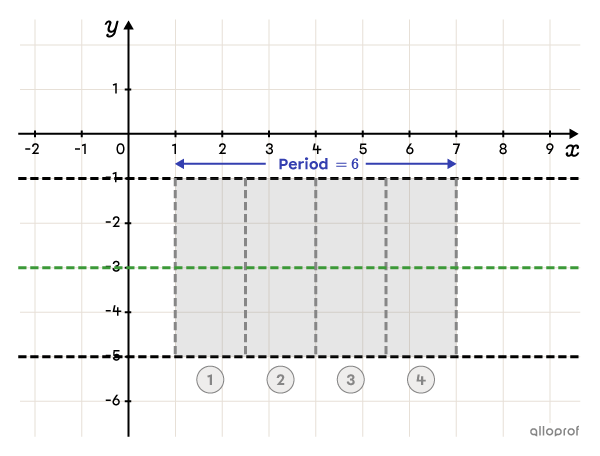
Draw the rectangle starting at |x=h| and divide it into 4 equal parts
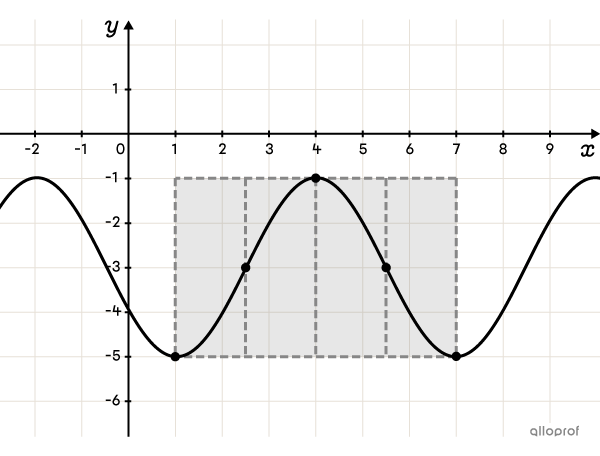
The rectangle starts at |x=1.|
To find the length, add the period at |h.| ||h+\color{#333fb1}p = 1+\color{#333fb1}6 = 7||
Draw a vertical line at |x=7.|
Divide the rectangle in two at |x=4,| and divide again in two at |x=2.5| and |x=5.5.|
Determine the starting point, other vertices, and inflection points
Since |a| is negative, the function starts at a minimum.
||\begin{align}(h&,k-\color{#fa7921}A)\\(1&,-3-\color{#fa7921}2)\\(1&,-5)\end{align}||
A quarter of a period later, place an inflection point at |(2.5,-3).| Another quarter of a period later, place a vertex at the maximum |(4,-1).| Continue in the same way, placing another inflection point at |(5.5,-3).| Finish at the end of the cycle with a vertex placed at the minimum |(7,-5).|

Graph a first cycle and continue the curve on the rest of the Cartesian Plane
To properly scale the axes, analyse the period (determined in step 1) and the extrema (determined in step 2).
Scale the |x|-axis
Since the period is divided into 4 equal parts, the scale on the |x|-axis must be at most equal to |\color{#EC0000}{\dfrac{1}{4}}\color{#333fb1}p.| In the previous example, we set a scale of |1| unit since |1<\dfrac{1}{4}p=1.5.|
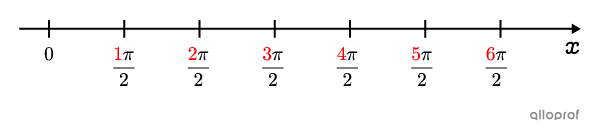
Sometimes the period is a multiple of |\pi,| like when using angles measured in radians. In this situation, scale the the |x|-axis using |\pi.| For example, if the period is |\color{#333fb1}{2\pi},| the scale could be |\dfrac{\pi}{2}.| ||\color{#EC0000}{\dfrac{1}{4}}\color{#333fb1}p=\color{#EC0000}{ \dfrac{1}{4}}{\color{#333fb1}{(2\pi)}}=\dfrac{\pi}{2}||
For now, the following scale is obtained.
Afterwards, the fractions can be reduced if desired.
Scale the |y|-axis
Scale the |y|-axis according to the maximum and minimum. Find a scale that provides enough space to draw a cycle.
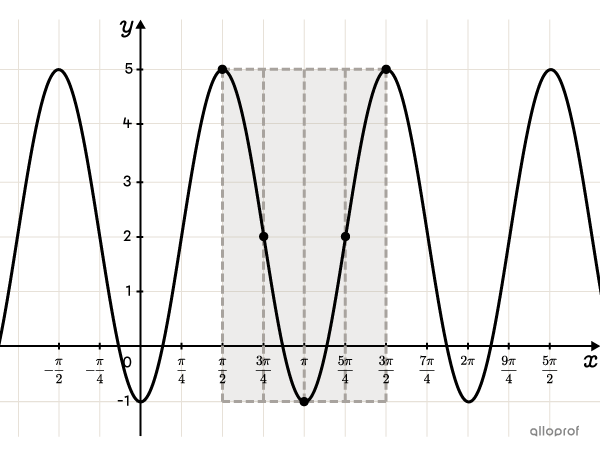
Graph the cosine function with the rule |f(x)=3\cos\!\bigg(2\left(x-\dfrac{\pi}{2}\right)\!\bigg)+2.|
Determine the amplitude, period, phase shift, and the axis of oscillation
From the rule, identify the parameters: |a=3,| |b=2,| |h=\dfrac{\pi}{2},| and |k=2.|
|\begin{align}\color{#fa7921}A&=\vert a\vert \\&=\vert 3\vert\\ &=\color{#fa7921}{3}\end{align}|
|\begin{align}\color{#333fb1}p&=\dfrac{2\pi}{\vert b\vert}\\&=\dfrac{2\pi}{\vert2\vert}\\&=\color{#333fb1}{\pi}\end{align}|
|\begin{align}\color{#a8a39e}{\text{Phase Shift}}&=h\\&=\color{#a8a39e}{\dfrac{\pi}{2}}\end{align}|
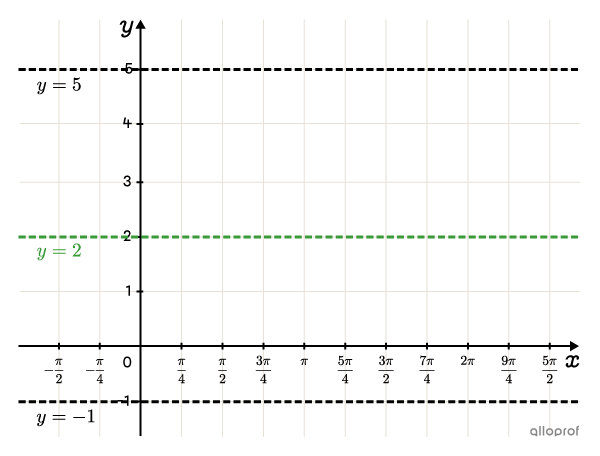
|\begin{align}\color{#3a9a38}{\text{Axis of Oscillation:}} &\ y=k\\ &\ \color{#3a9a38}{y=2}\end{align}|
Determine the maximum and minimum
|\begin{align}\max&=k+\color{#fa7921}A\\&=2+\color{#fa7921}{3}\\&=5\end{align}|
|\begin{align}\min&=k-\color{#fa7921}A\\&=2-\color{#fa7921}{3}\\&=-1\end{align}|
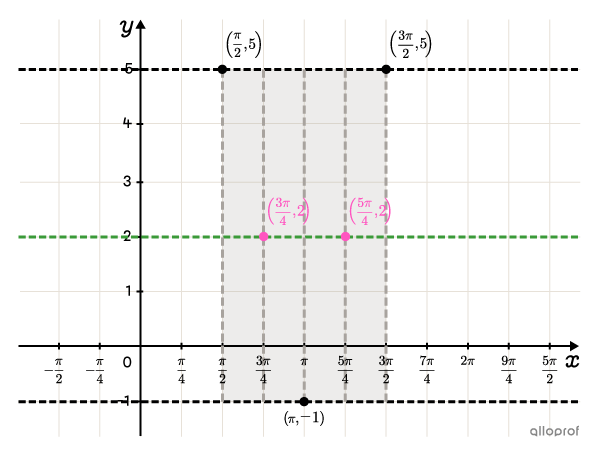
Draw the axis of oscillation and horizontal lines at the maximum and minimum
In the diagram, the axis of oscillation and lines at the maximum and minimum values are shown.
Since the period is |\pi,| the chosen |x| scale is |\color{#333fb1}{\dfrac{\pi}{4}}.| ||\color{#EC0000}{\dfrac{1}{4}}\color{#333fb1}p=\color {#EC0000}{\dfrac{1}{4}}{\color{#333fb1}{(\pi)}}=\dfrac{\pi}{4}||
Sketch the rectangle starting at |x=h| and divide it into 4 equal parts
The rectangle starts at |x=\dfrac{\pi}{2}.|
To find its length, add the period to |h.|
||\begin{align}h+\color{#333fb1}p&=\dfrac{\pi}{2}+\color{#333fb1}{\pi }\\&=\dfrac{\pi}{2}+\dfrac{2\pi}{2}\\&=\dfrac{3\pi}{2}\end{align}||
Divide the rectangle in two at |x=\pi,| and divide again in two at |x=\dfrac{3\pi}{4}| and |x=\dfrac{5\pi}{4}.|
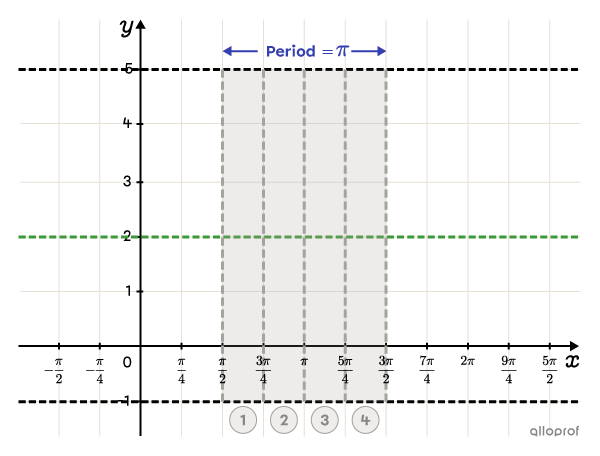
Determine the starting point, other vertices, and inflection points
Since |a| is positive, the function starts at a maximum.
||(h,k+\color{#fa7921}A)\\ \left(\dfrac{\pi}{2},2+\color{#fa7921}3\right)\\ \left(\dfrac{\pi}{2},5\right)||
A quarter of a period later, place an inflection point at |\left(\dfrac{3\pi}{4},2\right)\!.| Another quarter of a period later, place a vertex at the minimum |(\pi,-1).| Continue in the same way and place another inflection point at |\left(\dfrac{5\pi}{4},2\right)\!.| Finish at the end of the cycle with a vertex placed at the maximum |\left(\dfrac{3\pi}{2},5\right)\!.|
Graph a first cycle and continue the curve on the rest of the Cartesian plane