Subjects
Grades
This is a preparation guide for the end-of-year exams containing all the concepts covered in the first cycle of secondary school. To explain it all, each concept will be followed by an example and a link to a concept sheet in our virtual library.
To compare numbers, it is better to use only one type of notation. Since the set of |\mathbb{Q}| contains the most elements with values that are easily illustrated, fractional notation |\left( \dfrac{a}{b} \right)| with |b \neq 0| will be used.
Place the following numbers in ascending order:
|4\dfrac{1}{3}\,| |\color{blue}{\dfrac{8}{3}}\,| |\color{red}{ -0{.}625}\,| |\color{green}{-80\ \%}\,| |\color{fuchsia}{\left( \dfrac{-1}{2} \right) ^2}\,| |\color{orange}{\sqrt9}|
In word problems, it is important to fully understand the context in order to choose the best approach. Thus, it is useful to follow these steps:
Create the chain of operations by highlighting keywords
Solve by following the order of operations
To make sure he's prepared for his exam on Friday, Simon wants to know how many minutes he's studied. On Monday, he studied half the time that he studied Tuesday. On Tuesday, he had his nose in his books from 6:30 p.m. to 7:20 p.m. On Wednesday, he spent 20 minutes less than the sum of the previous two days reading his notes. On his last day, he spent three times more than Monday's amount of time reviewing his work.
In total, how many minutes did Simon spend studying for his exam?
|
A number is divisible by... |
if... |
|---|---|
|
2 |
the ones digit is even. |
|
3 |
the sum of all digits in the number is divisible by 3. |
|
4 |
the number formed by its last two digits is divisible by 4, or if the number ends with at least two zeros. |
|
5 |
the ones digit is 0 or 5. |
|
6 |
the number is divisible by both 2 and 3. |
|
8 |
the number formed by its last three digits is divisible by 8, or when the number is divisible by 4 and 2. |
|
9 |
the sum of its digits is divisible by 9. |
|
10 |
the ones digit is 0. |
|
12 |
the number is divisible by both 3 and 4. |
|
25 |
the number ends with 00, 25, 50, or 75. |
Judith and her son Justin collected an impressive amount of candy from trick-or-treating in the neighbourhood on Halloween night. After a week and a few tummy aches, they want to give away what’s left. With Justin's birthday party just around the corner, Judith has come up with the great idea to share the rest of the |264| candies equally with each of Justin's friends who attend the party.
If Judith lets Justin invite |9| friends, will she be able to carry out her plan? If not, suggest a reasonable number of guests that would enable her to share the candy equally with everyone.
The concept of a percentage is an example of a proportional situation. To properly build the proportion to find the desired quantities, follow these steps:
Identify the quantity given and associate a percentage with it.
Identify the quantity sought and associate a percentage with it.
Construct the proportion according to the following model: ||\displaystyle \frac{\color{red}{\text{Quantity given}}}{\color{blue}{\text{Quantity you’re looking for}}} = \frac{\color{red}{\text{Its percentage}}}{\color{blue}{\text{Its percentage}}}||
Solve the proportional situation.
To take advantage of the end-of-season sale in a sports store, Mrs. Caron bought some bicycle accessories. With a |\color{red}{45\ \%}| discount, she got what she wanted for only |\color{red}{$14{.}85}|, taxes included.
What was the price (taxes included) before the discount?
We express a ratio using two superimposed points or a fraction.
|a : b| is the part-to-part ratio.
|\displaystyle \frac{a}{a+b}| is the part-to-whole ratio,
where |a| and |b| are parts of the same whole and generally prime (simplified ratio)
By definition, parts |a| and |b| of a ratio |a:b| are like units, thus, entering the units associated with each part is unnecessary.
After a professional sports competition, a bursary of |$5\ 000| was shared between the winning team and the other finalists. When the cheques were given, the winning team won |\color{red}{$3\ 500}|. The rest was given to the finalists.
What is the ratio associated with the amount given to the winners versus the finalists?
Generally denoted |a / b|, the rate creates a relationship between two unlike quantities or measurements.
We call this a unit rate if |b=1.|
The following describes the distance traveled by a truck driver during his most recent week of work:
|\color{red}{\text{Monday}: 476\ \text{km in} \ 6{.}5 \ \text{hrs}}|
|\color{blue}{\text{Tuesday}: 576\ \text{km in} \ 7{.}25 \ \text{hrs}}|
|\color{green}{\text{Wednesday}: 525\ \text{km in} \ 6{.}75 \ \text{hrs}}|
|\color{fuchsia}{\text{Thursday}: 712\ \text{km in} \ 9 \ \text{hrs}}|
|\color{orange}{\text{Friday}: 632\ \text{km in} \ 7{.}75 \ \text{hrs}}|
Based on the information given, on what day did the truck driver maintain the highest average speed?
For a situation to be proportional, the associated graph needs to:
Pass through the origin |(0,0).|
Be represented by a straight line.
Once the situation meets these criteria, use cross multiplication or the multiplicative coefficient to solve the problem.
To ensure the accuracy of their estimate, a heating equipment installation company uses the graph below to estimate expenses:

How much should the estimate be if the approximate amount of work is |\color{red}{125 \ \text{hours}}|?
For a situation to be inversely proportional the associated graph must have:
A decreasing curved line.
A line that does not touch the x-axis and y-axis.
Once the situation meets these criteria, it can be solved according to |x y = k|, where |k| is a constant.
When awarding prizes for the weekly draw of a national lottery, the jackpot is divided according to the number of winners. Here is an illustration of the last jackpot’s distribution:
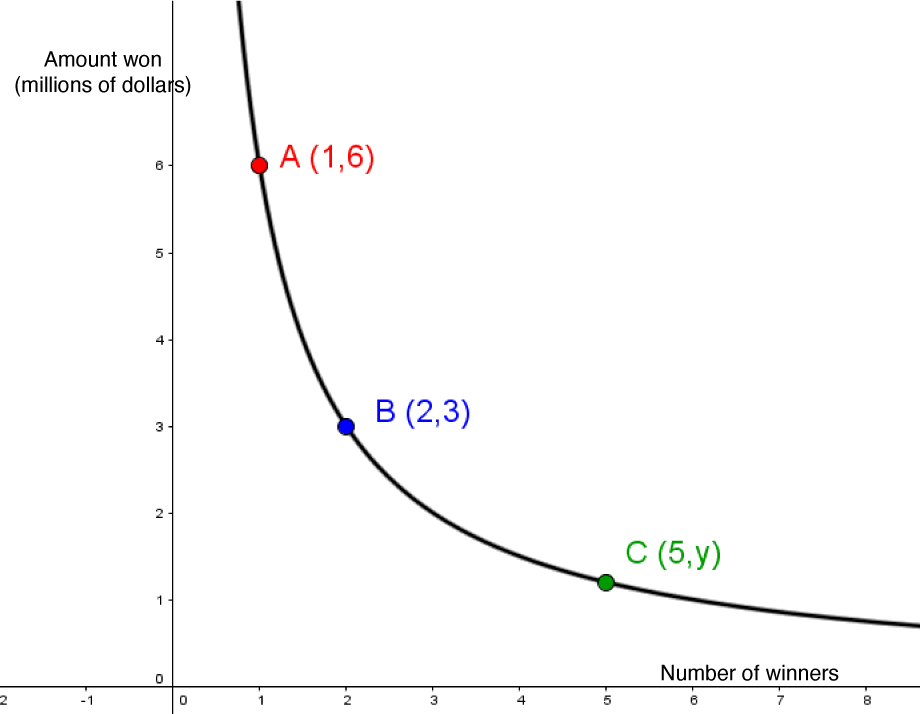
According to this situation, what amount would each participant win if there were 5 winners?
Knowing the names of each of the components in an algebraic expression helps in understanding their specific roles. These components have specific names:
Unknown: Desired numeric value.
Variable: Letter used to identify the unknown.
Coefficient: Multiplicative factor placed in front of the unknown.
Terms: Parts of an expression or equation that are separated by addition or subtraction.
Constant term (constant): Term consisting only of a number or where no variable appears.
Like terms: Terms made up of the same variables that are also assigned the same exponents.
Algebraic expression: Combination of several terms where the total is not known (no = sign).
Degree: In a monomial, it corresponds to the sum of the variables’ exponents. In a polynomial, it corresponds to the highest degree among the monomials of which it is composed.
Algebraic equation: Combination of several terms with a known result (with an = sign).
In the following algebraic expression: ||\color{blue}{-4x^3y} \color{red}{+3x^2} \color{fuchsia}{-\frac{3}{4} xy^4 } \color{green}{+ 9} \color{orange}{- 4xy^4}|| identify the following:
A) A constant term.
B) If it is an expression or an equation.
C) Its degree.
D) Like terms, if applicable.
E) The coefficient of the 2nd term.
To simplify an algebraic expression, follow the order of operations:
Multiplication and division: Apply to the coefficients, regardless of the terms.
Addition and subtraction: Apply to the coefficients of like terms.
Evaluating an algebraic expression: Substitute the variables by the values given.
To be more efficient, a company streamlines monthly revenues using the following algebraic expression: ||\displaystyle 2(4x^2-6) - \frac{1}{2}x^2 + (12x - 1) \div 4||
where |x = |number of hours worked by all employees
What is the income earned from a total of |325| hours worked in a month?
Generally, a problem using algebra can be solved by following these steps:
Identify the variables and unknowns.
Create the equation according to the context of the situation.
Simplify the resulting equation.
Solve the equation by isolating the variable.
Validate the answer using the initial equation.
For your class's gift exchange activity, you need to buy some food for the group meal, some paper plates, and a gift for the exchange that will take place after the meal.
After reviewing your bills, you realize that the food cost |$12| more than triple the amount for the plates, and you spent half the sum of the cost of the plates and food on your gift.
You spent exactly |$36| in total. Determine the amount of each of the three purchases.
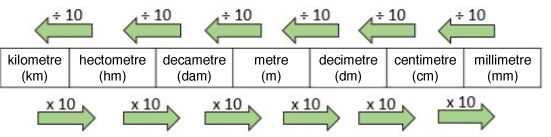
Length Units
Area Units
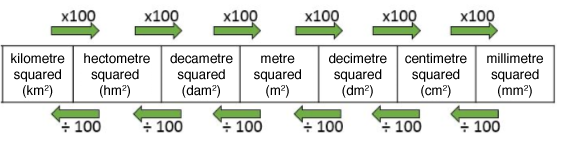
What is the measurement, in |\text{m}^2,| of a triangle with a base measuring |\color{blue}{ 820 \ \text{cm}}| and a height of | \color{red}{1{.}2 \ \text{dam}}|?
To define various plane figures and find missing measurements, reference is made to particular types of lines and line segments:
|\color{blue}{\text{Diagonal}\ (\overline{BD})}|: Line segment that connects two vertices which are not adjacent.
|\color{red}{\text{Median} \ (\overline{DF})}|: Line segment that connects a vertex with the midpoint of its opposite side.
|\color{green}{\text{Perpendicular bisector}\ (\overline{FH})}|: Line segment that is perpendicular to another segment and which divides the latter into two equal parts.
|\color{fuchsia}{\text{Bisector}\ (\overline{DE})}|: Line segment that divides an angle into two equal parts.
|\color{orange}{\text{Height}\ (\overline{DG})}|: Line segment starting from the vertex of a figure or a solid that is perpendicular to its base.

Associate each type of line segment with an element in the illustration below.

A) Identify a median.
B) Identify a perpendicular bisector
C) Identify a height.
D) Identify a bisector.
Regular polygons all have the same properties:
Every side has the same measurement.
Every angle has the same measurement.
The sum of the interior angles can be calculated using the formula: |(n-2) \times 180°|, where |n| is the number of sides.
They are formed by a set of isosceles triangles, except the hexagon that is formed by equilateral triangles.
They each have a different name depending on the number of sides.
The apothem is the line segment connecting the center of the polygon with the midpoint of one of its sides.
The apothem is perpendicular to the side it touches.
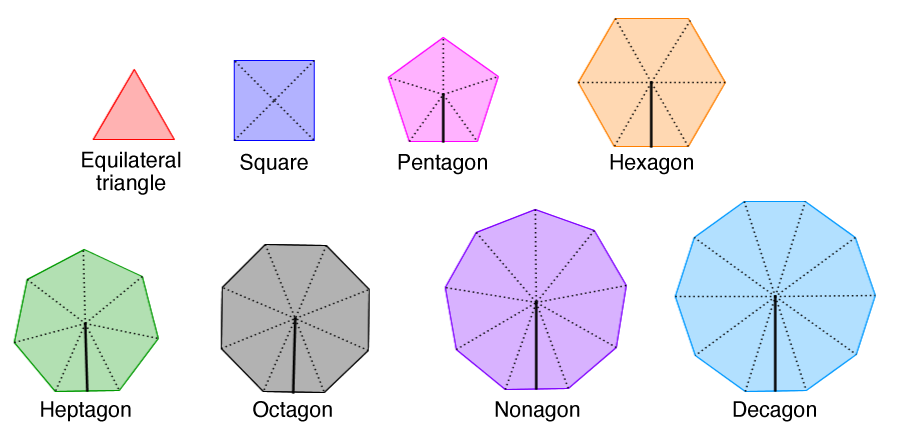
True or false: a regular octagon with a side measurement of |\color{red}{8 \ \text{cm}}| has a larger perimeter than a regular decagon with one side measuring |\color{blue}{7 \ \text{cm}}.|
To clearly distinguish the properties of different line segments in a circle, use the following terms:
|\color{orange}{\text{Chord} \ (\overline{CF})}|: Line segment which connects any two points on the circle.
|\color{red}{\text{Diameter}\ (\overline{DE})}|: Line segment which connects any two points of the circle passing through the centre.
|\color{green}{\text{Radius} \ (\overline{AO})}|: Generally noted |r| , it is a line segment which connects the centre of the circle to any point on the circle.
Circumference of a Circle |=| outline of the circle |= 2 \pi r.|
|\color{fuchsia}{\text{Arc of the circle} \ \overset{\huge\frown}{\small {AB}}}|: Curve joining two points on the circumference of the circle
||\displaystyle \frac{\color{fuchsia}{m \overset{\huge\frown}{\small {AB}}}}{\color{fuchsia}{m \ \angle AOB}} = \displaystyle \frac{\text{Circumference}}{360^\circ}||
Area of a Circle |=| surface covered by a disc |= \pi r^2.|
Area of a Sector: Portion of the circle which is delimited by two radii. ||\displaystyle \frac{\text{Area of the sector} AOB}{\text{Area of the circle}}= \displaystyle \frac{\color{fuchsia}{m \ \angle AOB}}{360^\circ}||

Cowboys use lassos to capture cattle. Lassos are made up of two parts: a rope and a loop. When the loop is undone, a professional cowboy wraps the lasso around his body eight times before placing it on a hook. The length necessary to make one loop corresponds to an arc of a circle intercepted by a central angle of |\color{red}{325^\circ}.|

What is the length of the rope, i.e., the part of the lasso without the loop?
Since it is a decomposable figure, it is necessary to work with each face’s area. Thus, the area formulas of plane figures will be used.
|
|A_\text{squared} = s^2| |
|A_\text{rectangle} = b\times h| |
|A_\text{rhombus} = \displaystyle \frac{D \times d}{2}| |
|
|A_\text{parallelogram}=b \times h| |
|A_\text{trapezoid} = \displaystyle \frac{(B+b)\times h}{2}| |
|A_\text{triangle} = \displaystyle \frac{b \times h}{2}| |
|
|A_\text{circle}=\pi r^2| |
|A_\text{regular polygon}= \displaystyle \frac{s a n}{2}| |
|
With the winter season coming up, a heavy machinery contractor is submitting bids to win snow removal contracts. To be competitive, he charges |$3{.}50/ \text{m}^2.|

What will be the amount of his bid for the snow removal contract, using the dimensions provided above?
It is preferable, for a decomposable solid, to work with the area of each face rather than with the total area of each solid used to build it. In other words, the area formulas of plane figures will be used.
|
|A_\text{square} = s^2| |
|A_\text{rectangle} = b\times h| |
|A_\text{rhombus} = \displaystyle \frac{D \times d}{2}| |
|
|A_\text{parallelogram}=b \times h| |
|A_\text{trapezoid} = \displaystyle \frac{(B+b)\times h}{2}| |
|A_\text{triangle} = \displaystyle \frac{b \times h}{2}| |
|
|A_\text{circle}=\pi r^2| |
|A_\text{regular polygon}= \displaystyle \frac{s a n}{2}| |
|
With the holiday season around the corner, you decide to play a prank on your parents by completely wrapping their gift with gray duct tape. To be precise, it is a square prism with a cylinder on top.
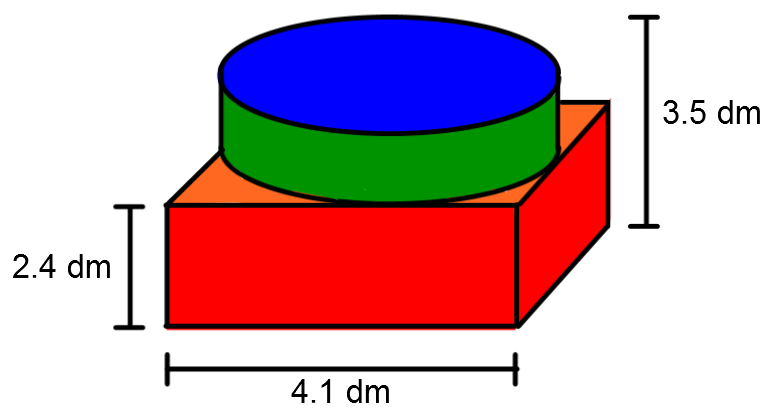
Using the measurements provided in the drawing above, how much tape, in |\text{dm}^2,| will you need?
Use the following steps to find a missing measurement:
Identify the measurements given.
Determine the formula to use.
Replace the known variables.
Isolate the desired variable.
A collector sees a chest that they are interested in buying inside an antique store. They need to know the chest’s height, because it must be the same as those which they already own. The total area of the chest was calculated during the restoration process.
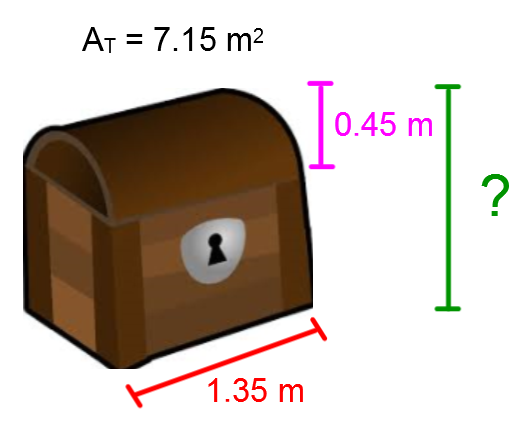
What is the height of the chest?
Here are the names of the different types of angles according to their measurements:
A zero angle: angle that measures |0^\circ.|
An acute angle: angle that measures between |0^\circ| and |90^\circ.|
A right angle: Often represented using a black square, it is an angle that measures exactly |90^\circ.|
An obtuse angle: angle that measures between |90^\circ| and |180^\circ.|
A straight angle: angle that measures exactly |180^\circ.|
A reflex angle: angle that measures between |180^\circ| and |360^\circ.|
A full (or complete) angle: angle that measures |360^\circ.|
Here are some definitions related to pairs of angles:
Adjacent angles: a pair of angles that share a common vertex and side and which are located on either side of the common angle.
Complementary angles: two angles where the sum of their measurements is |90^\circ.|
Supplementary angles: two angles where the sum of their measurements is |180^\circ.|
Two lines intersected by a transversal form pairs of remarkable angles. If the lines are parallel, several congruent angles can be found.
Thus, |d_1 // d_2| and |d_3,| is a secant, as follows:

The following angles are congruent:
Alternate-Interior angles |(\color{redorange}{m\angle BEG} = \color{fuchsia}{m\angle CBE})|: Angles which are on either side of the transversal, that do not share the same vertex, and are inside the parallel lines.
Alternate-Exterior angles |(\color{green}{m\angle ABF} = \color{orange}{m\angle DEH})|: Angles which are on either side of the transversal, that do not share the same vertex, and are outside the parallel lines.
Corresponding angles |(\color{red}{m\angle ABC} = m\angle BED)|: Angles which are on the same side of the transversal and do not share the same vertex. One angle is inside the parallel lines and the other, outside.
Vertically Opposite angles |(\color{blue}{m\angle FBE} = \color{red}{m\angle ABC})|: Angles which share the same vertex and where the sides of one of the angles are the extension of the sides of the other angle.
Finally, to derive angle measurements, it is sometimes helpful to remember that the sum of a triangle’s interior angles is |180^\circ.| For other polygons, apply the following formula:
The sum of the interior angles of a polygon |=(n-2)\times 180^\circ| where |n| is the number of the polygon’s sides.
What is |\color{red}{m\angle CBL}| in the following drawing?

Denoted |t_{(x,y)}|, a translation is an isometry since the measurements of the angles and corresponding sides remain identical.
A translation is generally defined by a translation arrow.
Using your geometry tools, perform the following translation:

Denoted |r_{(O,\text{degree})}|, a rotation is an isometry because the measurements of the angles and corresponding sides remain the same.
The rotation is defined by an angle of rotation.
Using your geometry tools, perform the rotation below.

Denoted |s_{\text{axis}}|, a reflection (symmetry) is an isometry since the measurements of the angles and corresponding sides remain the same.
A reflection is defined by a line of symmetry.
Using your geometric tools, perform the following reflection:

|h_{(O,k)}| establishes a similarity between the two figures since the corresponding angles are congruent and the corresponding sides are proportional.
Using your geometry tools, perform the dilation given by |h_{(O; 1,5)}|.

All Cartesian planes have the same characteristics:
Quadrants: they represent each of the four divisions of the Cartesian plane.
The x- axis: horizontal axis associated with the independent variable |(x).|
The y- axis: vertical axis associated with the dependent variable |(y).|
The origin: meeting point of the two axes with the coordinate |(0,0).|
Coordinates |(x,y)|: any point on the Cartesian plane has a pair of coordinates based on its value on the x-axis |x| and the y-axis |y.|
The axes: each of the axes is represented by a graduated straight line.
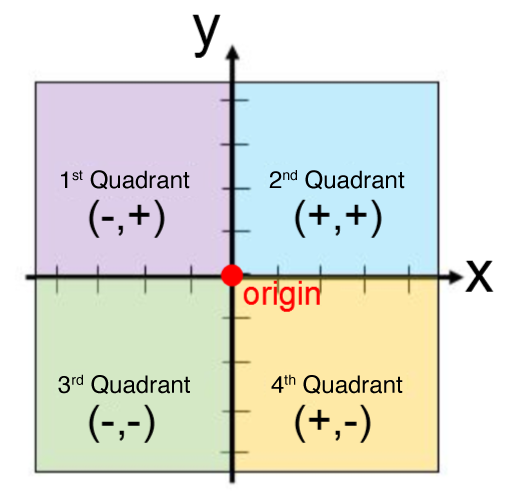
Place each of the following points on the Cartesian plane: ||A(2,3),\ B(-3,2),\ C(-2,-3),\ D(4,-2)||
To fully understand probability, it is important to differentiate between different types events:
Impossible: probability is equal to 0 (0%).
Certain: probability is 1 (100%).
Probable: probability is between 0 and 1 (between 0% and 100%).
Elementary: contains a single element.
Compatible/Incompatible: events where intersection is not empty/intersection is empty.
Dependent/Independent: when the 2nd draw’s outcome is influenced by the 1st draw or when the 2nd draw’s outcome is not influenced by the 1st draw.
Different situations will determine the qualifiers that are most appropriate for each.
1) A: Drawing an ace from a 52-card deck.
B: Drawing a king from another deck of 52 cards.
2) Rolling eight on a six-sided die.
3) Pick two balls consecutively without returning them to a basket containing 30 balls.
As in many fields, theory and practice often give two different results:
Experimental probability: Probability that is obtained following an experiment.
Theoretical probability: Probability that is obtained as a result of the theoretical analysis of the possible outcomes.
Study the following situation and decide if it refers to experimental or theoretical probability.
A) To determine the probability of obtaining a head or a tail when tossing a coin, Julian flips one 50 times and records each of the results. In the end, he gets |P(\text{tails}) = \displaystyle \frac{23}{50}| and |P(\text{heads})=\displaystyle \frac{27}{50}|.
B) Since a regular die has six identical sides, we can determine the following: |P(1) = P(2) = P(3) = P(4) = P(5) = P(6) = \displaystyle \frac{1}{6}.|
||\mathbb{P} = \displaystyle \frac{\text{Number of desired results}}{\text{Total number of possible results}}||
In addition, the number of possible results will be influenced if the draw is made with or without replacement.
To win the grand prize in a neighborhood festival, competitors must draw two black balls one after the other. They can do it one of two ways.
A) Draw from a basket containing 10 balls without returning them: five are red, three are green and two are black.
B) Draw from a basket containing 15 balls and replace the ball after the first draw: seven are red, five are green and three are black.
To maximize the odds, which approach should the competitors choose?
Here are two sampling methods that are frequently used:
Random: Elements are chosen at random, without a precise methodology.
Systematic: Elements are chosen respecting a precise frequency.
Identify the method that is the most appropriate for each situation.
1) Quality control in a factory checks 1 out of every 100 items that leave the production line.
2) To try to predict the results of the next election, we conduct a poll by asking people at a shopping mall entrance.
To ensure the credibility of a survey, certain pitfalls should be avoided during the setup, completion, and analysis of the survey data. For example, the following sources of bias are common:
Sample size: ensure that enough people are interviewed so that the results are representative of the population.
Formulation of questions: Ensure that the questions do not suggest a position or specific opinion (i.e., avoid leading questions).
In the following situations, indicate whether the question is biased or not. If yes, identify the source of the bias.
A) To find out what people think of the town hall expansion, the mayor sends a survey by mail to 1 000 of the 5 000 residents.
B) The following question is asked: "Do you not agree with the fact that a company should not move its head office to avoid losing certain tax advantages?"
In general, we can define the type of variable studied using the following qualifiers:
Qualitative: When the answer is a word or a phrase.
Quantitative Discrete: When the answer is a numerical value that is a whole number (belonging to the set of integers |(\mathbb{Z}).|)
Quantitative Continuous: When the answer given is a numerical value that can have decimal form (belonging to the set of real numbers |(\mathbb{R}).|)
Identify the type of variable being studied in the following situations.
A) People are asked about their favourite pet.
B) People are asked how many pets they have in their homes.
Once the data has been collected, it must be analyzed to draw satisfactory conclusions. To do that, some numerical values can be used:
Mean |= \displaystyle \frac{\text{Sum of data}}{\text{Total number of data}}|
Range |= \text{Maximum value} - \text{Minimum value}|
Minimum |= \text{Smallest value in the distribution}|
Maximum |= \text{Largest value in the distribution}|
To have an idea of the sizes for the sportswear that a school wants to provide to different team members, |\color{blue}{20}| students were asked to give their measurements. Here are the results obtained about the sizes (in cm) of each student:
|\color{green}{120,}| |\color{red}{124,}| |\color{red}{124,}| |\color{red}{ 125,}| |\color{red}{127,}| |\color{red}{128,}| |\color{red}{129,}| |\color{red}{130,}| |\color{red}{131,}| |\color{red}{134,}| |\color{red}{134,}| |\color{red}{134,}| |\color{red}{141,}| |\color{red}{142,}| |\color{red}{142,}| |\color{red}{143,}| |\color{red}{145,}| |\color{red}{147,}| |\color{red}{148,}| |\color{fuchsia}{149}|
Using this distribution, determine the mean and range.
Use the following list to ensure that all elements are included when setting up a bar graph.
Build a distribution table.
Label the axes and give the title of the graph.
Ensure that an appropriate scale (graduation) is used and enough space is available to write the different terms/values of the survey.
Associate the size of the bars with the frequency of each of the terms/values.
People at the entrance to a shopping centre are asked about the number of gifts they are thinking of giving to members of their family. The following answers were obtained:
|3,| |4,| |2,| |6,| |5,| |3,| |5,| |6,| |1,| |4,| |1,| |5,| |4,| |6,| |8,| |5,| |6,| |8,| |4,| |5,| |3,| |6,| |2,| |4,| |5,| |2,| |6,| |5,| |3,| |2|
To have a better idea of people's intentions, display the data using a bar graph.
Use the list below to ensure all elements are included when setting up a pie chart.
Build a distribution table with the corresponding central angles.
|
Terms or values |
Number |
Relative Frequency(%) |
Central Angle (°) |
|---|---|---|---|
|
According to answers given |
Enumeration of each term/value |
|\displaystyle \frac{\text{Frequency of number analyzed}}{\text{Total frequency}} \times 100| |
|\displaystyle \frac{\text{Frequency}}{100 \%} = \frac{\text{m of the angle}}{360^\circ}| |
Draw each of the sectors using their respective central angles.
Add a legend and a title.
Make sure the percentages are written in each of the sectors.
To obtain a global perspective of the company's investment income, the general manager wants you to arrange the following information in a pie chart: ||\begin{align} \color{blue}{\text{Salary}} &= \color{blue}{$1 \ 190 \ 000} \\ \color{orangered}{\text{Electricity}} &= \color{orangered}{$420 \ 000} \\ \color{gray}{\text{Heating}} &= \color{gray}{$315 \ 000} \\ \color{orange}{\text{Marketing}} &= \color{orange}{$700 \ 000} \\ \color{darkblue}{\text{Investments}} &= \color{darkblue}{$245 \ 000} \\ \color{green}{\text{Renovations}} &= \color{green}{$630 \ 000} \end{align}||
Here’s your chance!