Subjects
Grades
Here is a brief study guide containing all the concepts covered in the Secondary 4 CST mathematics pathway. To explain everything, each formula will be followed by an example and a link to a concept sheet in our virtual library.
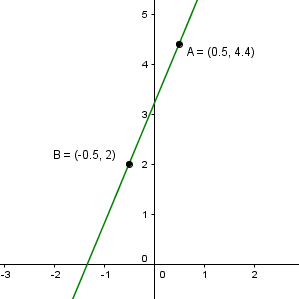
||y = ax + b||
where
||a = \dfrac{\Delta y}{\Delta x} = \dfrac{y_2 - y_1}{x_2 - x_1}||
With the information provided in the graph below, determine the line’s equation in function (standard) form.
||y = ax^2||where the value of |a| is determined by substituting a known point.
With the information provided in the graph below, determine the equation of the parabola.

For a second-degree polynomial function, |a \ne \dfrac{\Delta y}{\Delta x}.|
||y = a(c)^x|| where
|a|: Initial value
|c|: Base (multiplying factor)
In 2005, there were 500 toads in a pond. The population is decreasing by 5% each year. If the population continues to decline at this pace, in what year will there be approximately 368 toads?
In this type of graph, the solid (closed) points (|\bullet|) represent datas that are included, while empty (open) points (|\circ|) represent datas that are not included.
When the Videotron Centre opened in the city of Quebec, all Quebecers could purchase tickets to visit. In theory, the visit lasted two hours, but visitors had the option of leaving after one hour. This situation can be modelled according to the following graph:
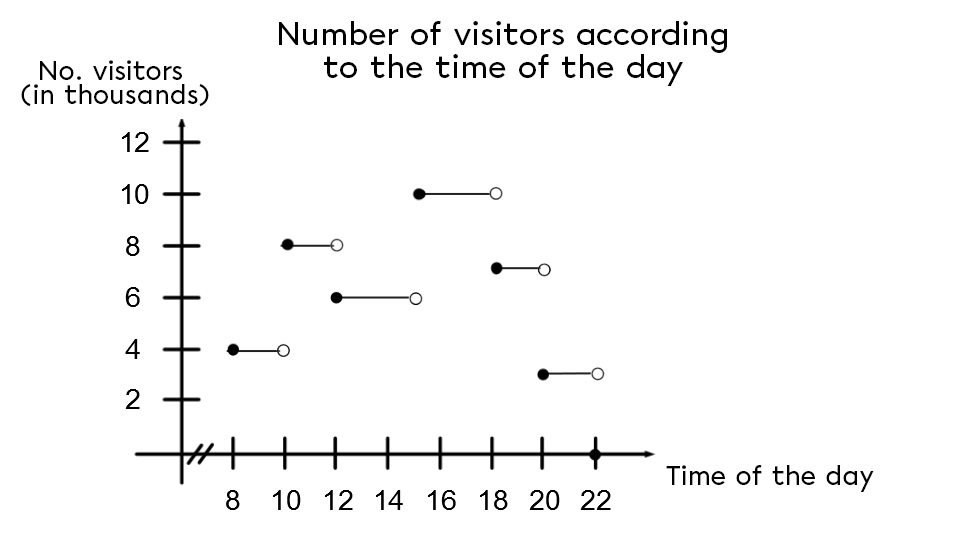
According to the graph above, how many Quebecers were visiting the Videotron Centre at 6 p.m.?
In a periodic function, a cycle is a repeating pattern, while the period is the length of one cycle along the |x|-axis.
Marie-Claude decides to get back in shape after a vacation by cycling with her group of friends. A coach travels with the group, guiding them and deciding what speed to maintain. The trainer gives the following graph to each group member to prepare them for the next session:
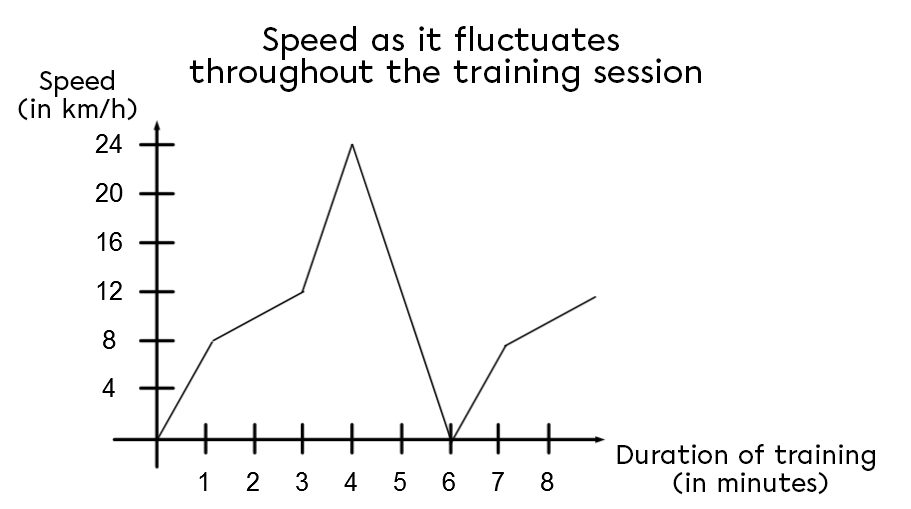
The training consists of repeating the same route for 45 minutes. By the end of her training, how many minutes, in total, will Marie-Claude have pedaled at a minimum speed of 16 km/h?
The same properties must be analyzed each time a function is studied:
the domain: all possible |x| values
the range: all possible |y| values
the x-intercept: the value of |x| when |y=0|
the y-intercept: the value of |y| when |x=0|
maximum: the greatest value of |y|
minimum: the smallest value of |y|
increase: when the graph "goes upwards" or is constant
decrease: when the graph "goes downwards" or is constant
positive sign: interval of x of the graph that is above or equal to the |x|-axis
negative sign: interval of x of the graph that is below or equal to the |x|-axis
As an accountant of a large company, you must give a detailed account of the trends in profits over the past year. To help, here is a graph of the last 12 months.
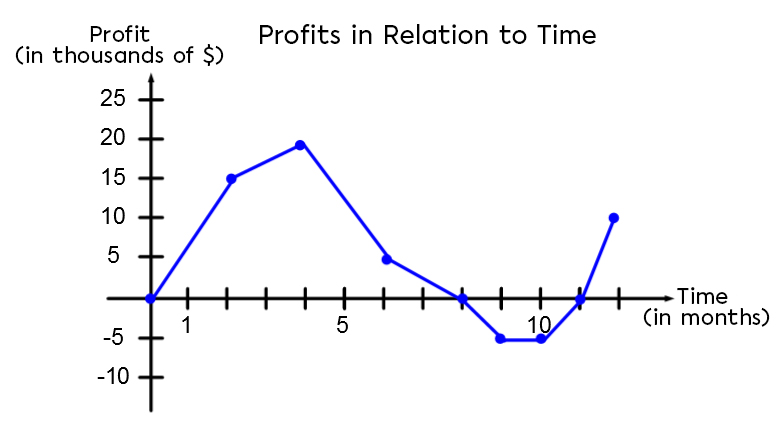
To properly defend your argument, you must complete a full study of the graph before preparing your presentation speech.
Follow these steps to solve a system of equations using comparison:
Identify the variables associated with the unknowns.
Create the equations according to the situation.
Isolate the same variable in each equation.
Compare the two equations to form a new one.
Solve this new equation.
Substitute the found variable’s value into one of the starting equations to find the value of the other.
At a corner store, a group of workers buys 4 coffees and 6 muffins for |$15{.}06.\ |The next day, this same group buys 3 coffees and 5 muffins for |$11{.}97.\ |If the following day they want to buy 6 coffees and 4 muffins, how much will it cost?
We can follow these steps to solve a system of equations using substitution:
Identify the variables associated with the unknowns.
Create the equations according to the situation.
Isolate a variable in one of the two equations.
Substitute this same variable in the other equation with the algebraic expression associated with it.
Solve this new equation.
Substitute the found variable’s value into one of the starting equations to find the value of the other variable.
At a corner store, a group of workers buys 4 coffees and 6 muffins for |$15{.}06.\ |The next day, this same group buys 3 coffees and 5 muffins for |$11{.}97.\ |How much will it cost if they want to buy 6 coffees and 4 muffins the day after that?
We can follow these steps to solve a system of equations through elimination:
Identify the variables associated with the unknowns.
Create the equations according to the situation.
Find equivalent equations to obtain the same coefficient for the same variable.
Subtract the two equations.
Isolate the remaining variable to find its value.
Substitute the found value of this variable into one of the starting equations to find the value of the other variable.
At a corner store, a group of workers buys 4 coffees and 6 muffins for |$15{.}06.\ |The next day, the same group buys 3 coffees and 5 muffins for |$11{.}97.\ |How much will it cost if they want to buy 6 coffees and 4 muffins the day after that?
We can deduce three theorems from the following right-angled triangle.
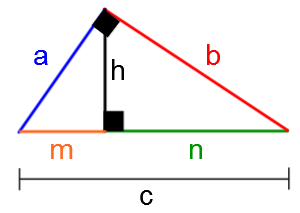
The measure of each side of the right angle in a right triangle is the geometric mean between its projection onto the hypotenuse and the hypotenuse itself. ||\begin{align} \dfrac{m}{a} = \dfrac{a}{c}\ &\Leftrightarrow\ a^2 = m c \\\\ \dfrac{n}{b} = \dfrac{b}{c}\ &\Leftrightarrow\ b^2 = n c \end{align}||
In a right triangle, the measure of the height from the vertex of the right angle (altitude) is the geometric mean of the projections of the sides onto the hypotenuse. ||\dfrac{m}{h} = \dfrac{h}{n}\ \Leftrightarrow\ h^2 = m n||
The product of the measures of the hypotenuse and the height (altitude) in a right triangle equals the product of the measures of the sides of the right angle. ||c h = a b||
To stand out from other contractors, a construction company suggests houses with roofs of different shapes. The following form is among these choices:
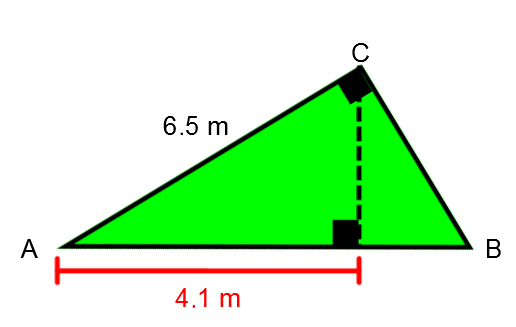
An entrepreneur needs the two missing outer measurements of this triangle |(\overline {AB}, \overline {BC})| to estimate production costs. Help him find them.
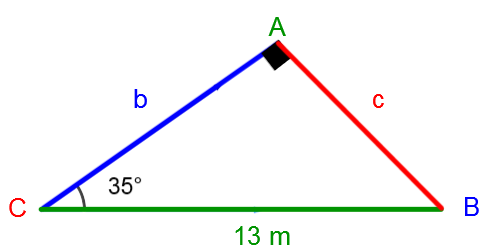
Considering the angle |\theta| as a reference, we get:
|\sin \theta = \dfrac{\text{Measure of the side opposite to }\ \theta}{\text{Measure of the hypotenuse}}|
|\cos \theta = \dfrac{\text{Measure of the side adjacent to }\ \theta}{\text{Measure of the hypotenuse}}|
|\tan \theta = \dfrac{\text{Measure of the side opposite to } \ \theta}{\text{Measure of the side adjacent to } \ \theta}|
The elevation angle of a house's roof trusses must be a minimum of |25^\circ| for building standards to be met. To ensure this constraint is respected, a manufacturer decides to make this angle |35^\circ.| If we know that the length of the roof truss is 13 metres, what will be the measurements of the other two sides?
To determine a helicopter’s route to rescue people in distress in the forest, a map of the region has been triangulated with the current location of the helicopter, the hospital, and the people who need help.
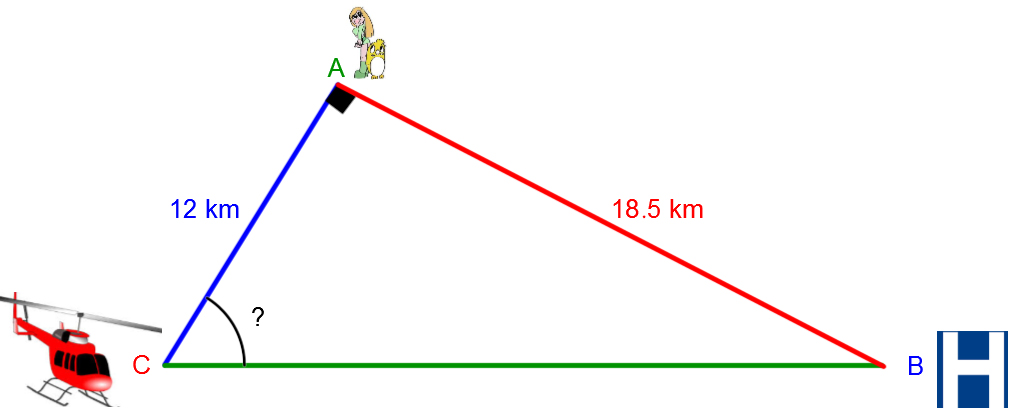
According to this drawing, what angle of orientation should the helicopter use to reach the people in distress as quickly as possible?
It is possible to deduce a series of equivalences for any given triangle.
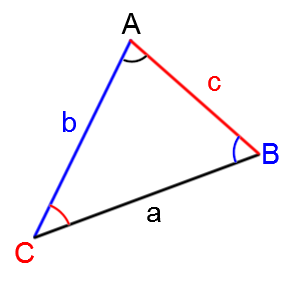
|\dfrac{a}{\sin A} = \dfrac{b}{\sin B} = \dfrac{c}{\sin C}|
At some Western events, horse races are organized to liven up the show. During these races, cowboys must ride around each of three barrels, which are arranged in the shape of an isosceles triangle.
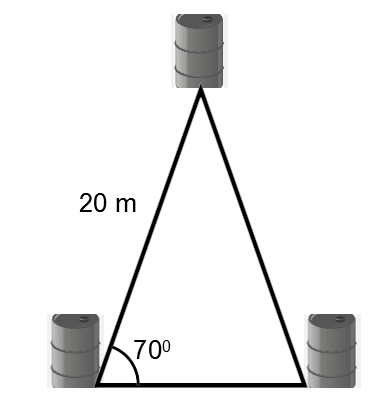
With the measurements given, what is the distance between each barrel?
To maximize aerodynamics, the shape of some race cars resembles a triangle.
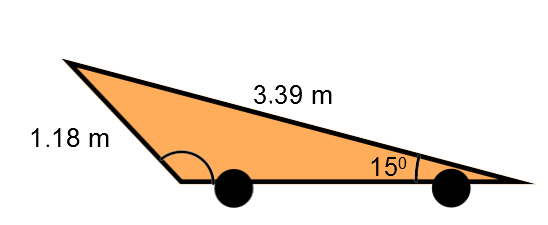
What should the measurement of the angle near the rear wheel be to maintain these proportions?
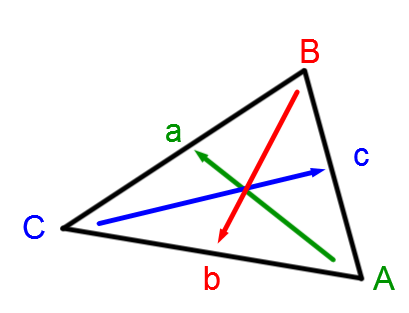
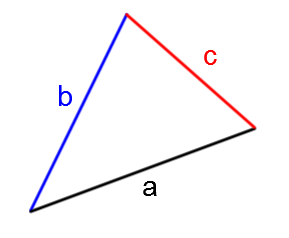
When identifying the triangle, it is essential to identify:
|\color{green}{\text{side a opposite to angle A}}|
|\color{red}{\text{side b opposite to angle B}}|
|\color{blue}{\text{side c opposite to angle C}}|
We can calculate the area of any triangle using the formula below.
|\text{Area}=\sqrt{p(p - a)(p - \color{blue}{b})(p - \color{red}{c})}|
where
|p=\dfrac{a + \color{blue}{b} + \color{red}{c}}{2}|
To ensure its security, a bank wants to calculate the area of its floor that is covered by surveillance camera.
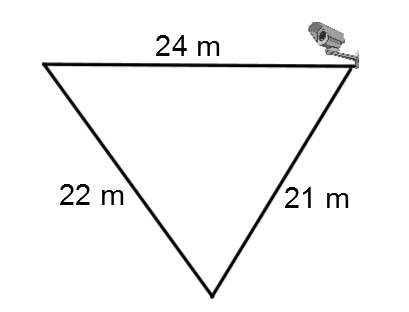
Determine the area of this space using the information provided above.
A - S - A: Two triangles are isometric when a pair of corresponding congruent sides is located between two pairs of corresponding congruent angles.
S - A - S: Two triangles are isometric when a pair of corresponding congruent angles is located between two pairs of corresponding congruent sides.
S - S - S: Two triangles are isometric when all pairs of corresponding sides are congruent.
Due to machinery problems, employees at a construction company must assemble the triangular-shaped roof trusses themselves to complete the construction of a house. However, they must make sure that all of the trusses are identical.
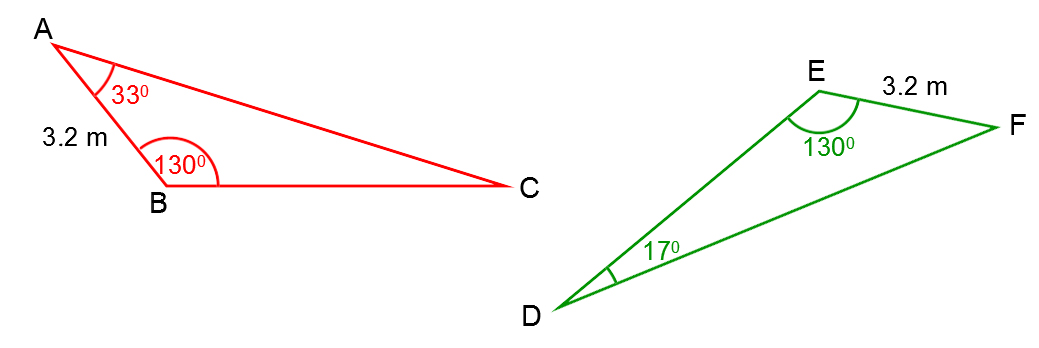
Using the information provided above, demonstrate that these two constructions are congruent.
A - A: Two triangles are similar when two pairs of corresponding angles are congruent.
S - A - S: Two triangles are similar when a pair of corresponding congruent angles is located between two pairs of proportional corresponding sides.
S - S - S: Two triangles are similar if all three pairs of corresponding sides are proportional.
The city is organizing a family run as part of a fundraiser for a community group. They want the path taken by the adults to be similar to the one taken by the children.
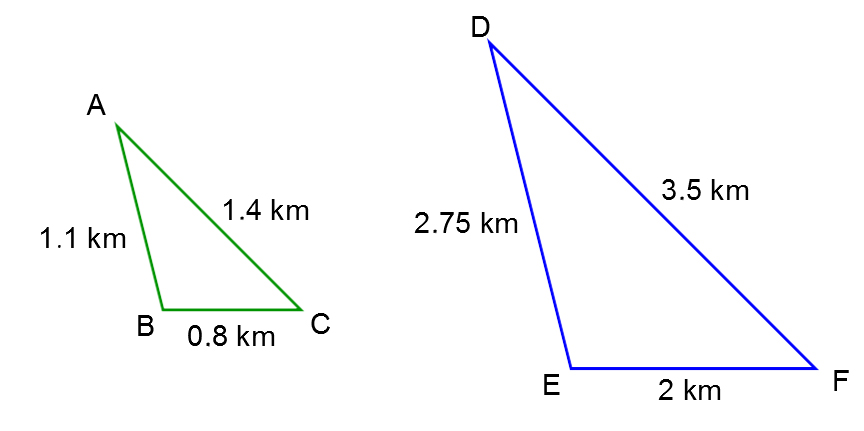
Demonstrate that the two paths are similar using the information provided above.
|\text{Distance} = \sqrt{(y_2 - y_1)^2 + (x_2 - x_1)^2}|
where
|(x_1, y_1):| Coordinates of the starting point of the segment
|(x_2, y_2):| Coordinates of the ending point of the segment
To determine the amount of gasoline that an airplane must have in its tank to complete a Montreal-Paris flight, both cities are represented on a Cartesian plane (graduated in kilometres).
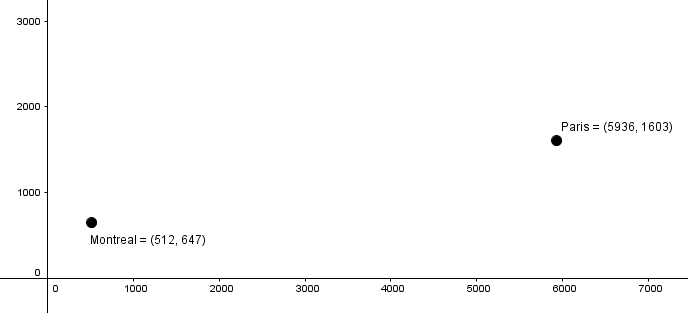
What is the distance, in kilometres, between these two cities?
Consider |(x,y),| the coordinates of the desired division point. ||x=x_1+ \dfrac{a}{b} (x_2-x_1)|| ||y=y_1+ \dfrac{a}{b} (y_2-y_1)||
Where
|(x_1,y_1):| Starting point of the segment
|(x_2,y_2):| Endpoint of the segment
|\dfrac{a}{b}:| Fraction that defines the division of the segment (part to whole)
Every morning, you wait at the bus stop for the bus to take you to school. You’ve noticed that, to centralize the stop for the students in the area, the segment of the street from your house to the school has been divided into a ratio of |1 : 4.|
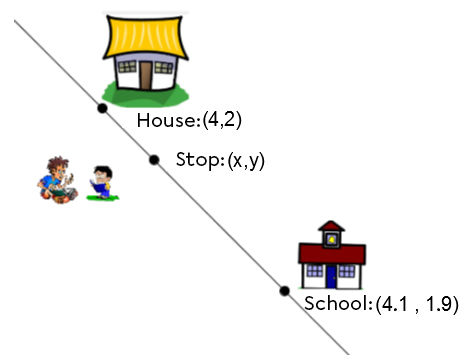
Using the given information, determine your bus stop’s coordinates.
It is important to differentiate between the two types of notations that are used to illustrate the portions associated with a division point in order to use the appropriate notation for the formula: ||\begin{matrix}\text{Ratio} \\ \Large{a:b} \end{matrix} \Leftrightarrow\ \begin{matrix}\text{Fraction} \\ \large\frac{a}{a+b} \end{matrix}||
The lines |y_1 = a_1 x + b_1| and |y_2 = a_2 x + b_2| are parallel if and only if |a_1 = a_2.|
What is the equation of the line that is parallel to the one identified in the Cartesian plane below and that passes through point C?
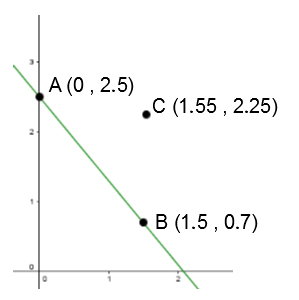
The lines |y_1 = a_1 x + b_1| and |y_2 = a_2 x + b_2| are perpendicular if and only if |a_1 \times a_2 = -1.|
We also say that two lines are perpendicular if the slope of one is the opposite of the reciprocal of the slope of the other: |a_2 = \dfrac{-1}{a_1}.|
What is the equation of the line that is perpendicular to the one identified in the Cartesian plane below and that passes through point C?

|MD = \dfrac{\sum \mid x_i - \overline {x} \mid}{n}|
Where
|x_i| represents each data.
|\sum| represents the sum.
|n| represents the total number of data.
During the last month, 11 houses in the same neighbourhood were sold for the following prices:
|\color{blue}{\$156\ 700},| |\color{red}{\$158\ 900 },| |\$159\ 000\,| |\$162\ 500\,| |\$164\ 100,| |\$167\ 400,| |\$172\ 000,| |\$175\ 000,| |\$178\ 100,| |\$179\ 000,| |\$183\ 000.|
For statistical purposes for realtors, calculate the mean deviation of this distribution.
|R_{100}(x) = \displaystyle \frac{\text{number of data less than the value in question} + \frac{\text{number of equal data }}{2}}{\text{total number of data}} \times 100|
Note: We round up to the whole number if the answer is not a whole number.
Candidates must pass a written test before being hired to fill positions in the federal government’s public sector. Here is the list of results, in percentages, of the different candidates:
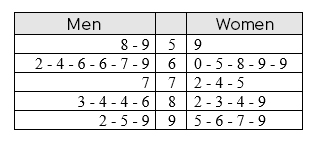
To ensure that they retain the best candidates, only those with a result higher than the |85^th| percentile rank will be retained. In light of this information, will your application be successful if you get a result of |84\ \%?|
|\text{Position of the data } = \dfrac{\text{percentile rank}}{100} \times \text{total number of data}|
Note: Round down if the answer is not a whole number.
Candidates must complete a written test before being hired to fill positions in the federal public sector. Here is the list of results, in percentages, of the different candidates:

To ensure that you keep the best candidates, only those with a result higher than the |82^nd| percentile rank will be retained. In light of this information, starting from which test result will the candidates be selected?
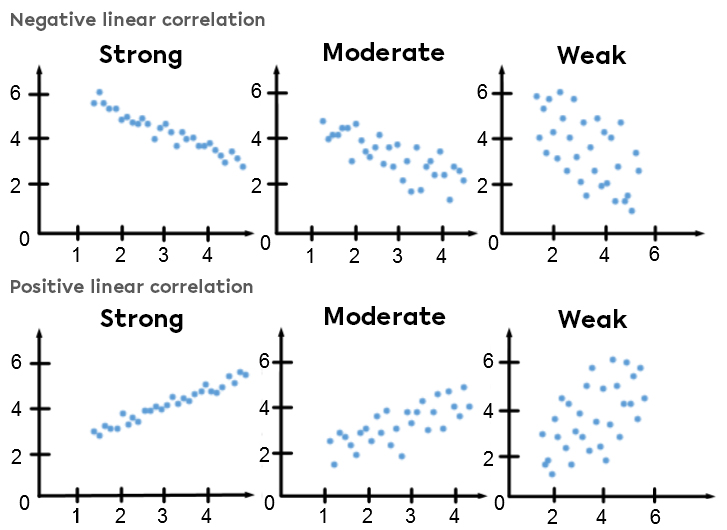
The scatter plot is used to estimate the correlation between two variables. The correlation coefficient must be calculated to get a more precise idea of the correlation.
A new company has increased its profits for five years and seeks to expand its production centre. However, the owners want to ensure that the economic growth of their company is positive and strongly correlated. To break it all down, here's a count of business income for the past 30 weeks.
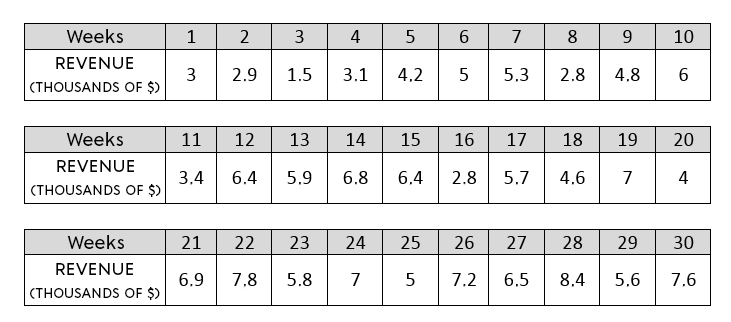
In your opinion, is the economic growth of the company positive and strongly correlated?
After framing the scatter plot and measuring the length |(L)| and width |(l)| of the rectangle:
||r = \pm \left(1 - \dfrac{l}{L}\right)|| The sign depends on the direction of the scatter plot (whether it is increasing or decreasing).
This coefficient can also be used to qualify the correlation:
| Value |r| | Linear correlation strength |
|---|---|
| Near |0| | >Zero |
| Near |\pm 0{.}50| | Weak |
| Near |\pm 0{.}75| | Moderate |
| >Near |\pm 0{.}87| | Strong |
| Near |\pm 1| | Very strong |
| |\pm 1| | Perfect |
To take stock of the success of students who enroll in adult education institutions, the administration team is studying the correlation between absenteeism (in hours) and students’ final grades (in %). They grouped the data into a scatter plot to properly analyze the situation:
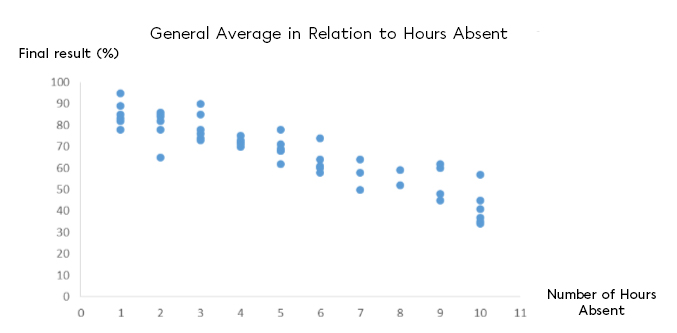
What is the correlation coefficient of this study?
Follow these steps to find the equation of the regression line according to the Median-Median method:
Put the points in ascending order according to the value of |x.|
Divide the pairs into three equal groups, if possible.
Calculate the median coordinates |(M_1, M_2, M_3)| of each group.
Calculate the mean coordinates |(P_1)| of the three midpoints.
Calculate the value of the slope |(a)| with |M_1| and |M_3.|
Calculate the value of the initial value |(b)| using |P_1.|
Write the equation of the regression line in the form |y = ax + b.|
Before building a new condo tower and doing the landscaping, the heights of the surrounding trees are measured to ensure they do not obscure the view for at least the next 20 years. To estimate the height the balconies should be, the following table of values is used:

Using this information, determine how high the first balconies should be so that their view is not obstructed by trees.
Even though the situation and data are the same, it is normal that the final answer varies depending on the method used (Median-Median method or Mayer method).
Since these methods are used to estimate and not to predict outcomes with certainty, there may be a difference between the two outcomes.
Follow these steps to find the equation of the regression line according to Mayer’s method:
Put the points in ascending order according to the value of |x.|
If possible, divide the pairs into two equal groups.
Calculate the mean points |(P_1| and |P_2)| of each group.
Use these mean points to find the value of the slope |(a)| and the initial value |(b).|
Write the equation of the regression line in the form |y = ax + b.|
Before building a new condo tower and doing the landscaping, the heights of the surrounding trees are measured to ensure they do not obscure the view for at least the next 20 years. To estimate the height that the balconies should be, the following table of values is used:
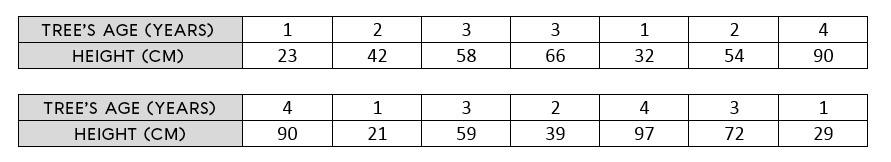
Using this information, determine how high the first balconies should be so that the view is not obstructed by trees.
Although the situation and data are the same, it is normal that the final answer varies depending on the method used (Median-Median method or Mayer method).
Since these methods are used to estimate and not to predict outcomes with certainty, there may be a difference between the two outcomes.